Geoscience Reference
In-Depth Information
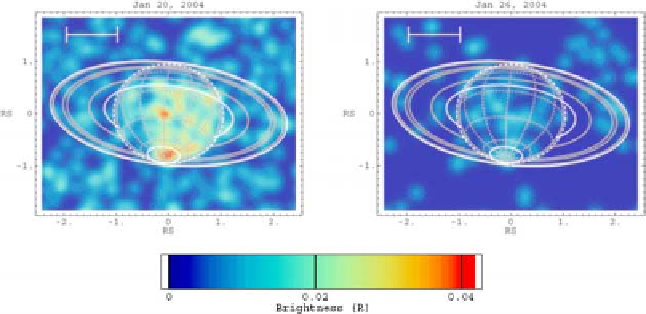
Fig. 10. Chandra ACIS X-ray 0.24-2.0 keV images of Saturn on January 20 and 26,
2004. Each continuous observation lasted for one full Saturn rotation. The white scale
bar in the upper left of each panel represents 10
. The superposed graticule shows
latitude and longitude lines at intervals of 30
. The solid gray lines are the outlines of
the planet and rings, with the outer and inner edges of the ring system shown in white.
The dotted white line defines the region within which events were accepted as part of
Saturn's disk unless obscured by the rings. The white oval around the south pole defines
the polar cap region [see Ref. 41 for details].
The Chandra observations in January 2004 also revealed X-rays from
Saturn's south polar cap on January 20 (see Fig. 10, left panel). However,
the analysis suggest
41
that X-ray emissions from the south polar cap region
on Saturn are unlikely to be auroral in nature; they might instead be an
extension of its disk X-ray emission.
7. Discussion
Table 2 presents a summary of the main characteristics of X-rays from
the three planets. X-rays from the low-latitude (non-auroral) disk of all
the three planets are mostly produced by scattering of solar X-rays by
atmospheric species. On Jupiter and Saturn the scattering is dominantly
resonant scattering with minor (
∼
<
10%) contribution from fluorescent
scattering.
34
,
38
0.2-
2.0 keV are scattered back. The energy-average geometric X-ray albedo of
Jupiter and Saturn over this energy range is
However, not all the incident solar X-rays in the
∼
10
−
4
(Refs. 35, 41). At
Jupiter precipitation of radiation belt ions can also make some contribution
to the disk X-rays.
33
∼
5
×