Geoscience Reference
In-Depth Information
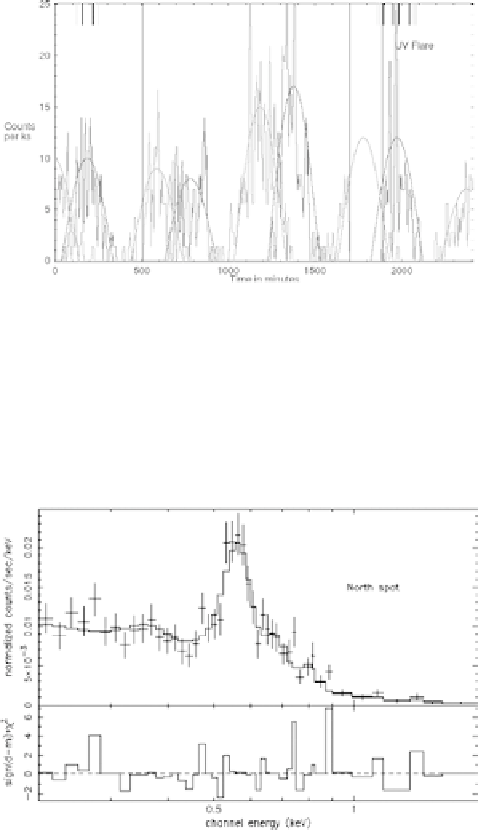
Fig. 5. Chandra observed X-ray count rate for the north (dark) and south (light) auroral
zones of Jupiter. The time origin corresponds to 1558:06 UT on February 24, 2003. The
black vertical lines mark the transitions from ACIS-S to HRC-I exposures and back to
ACIS-S. The bars at the top mark the simultaneous HST observations in different mode
(see Ref. 26 for details). Note that the set of exposures containing the UV flare coincides
with the tallest peak in the ACIS-S light curve for the northern auroral zone. Smooth
sections of sine waves provide crude representations of projected area effects arising from
the planet's rotation.
Fig. 6. XMM-Newton EPIC spectrum of Jupiter's northern auroral spot.
27
Best-fit
(solid line) for the data (symbol) is obtained with five narrow Gaussian lines and a
power law continuum. Bottom panel shows the chi-square of the residual (see Ref. 27 for
details).
acceleration to attain energies of
>
1 MeV/nucleon before impacting the
Jovian upper atmosphere.
26
−
30
However, the source of precipitating ions —
whether it is outer magnetospheric or solar wind origin, or a mixture of
both, is currently not clear and arguments in favor of either of them have
been presented.
26
-
30