Geoscience Reference
In-Depth Information
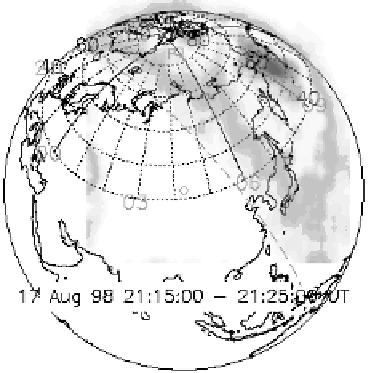
Fig. 3. X-ray image of Earth on August 17, 1998 from Polar PIXIE instrument (energy
2.9-10.1 keV), showing the dayside X-rays during a solar X-ray flare. The grid in the
picture is in geomagnetic coordinates, and the numbers shown are magnetic local time.
The day-night terminator at the surface of the Earth is shown as a dashed line.
by the emission of characteristic K-shell lines of Nitrogen, Oxygen, and
Argon. Figure 3 shows the PIXIE image of Earth demonstrating the X-rays
(2.9-10 keV) production in the sunlit atmosphere during a solar flare of
August 17, 1998. The X-ray brightness can be comparable to that of a
moderate aurora. For two solar flare events during 1998 examined using
the data from PIXIE, the shape of the measured X-ray spectra was in
fairly good agreement with modeled spectra of solar X-rays scattered and
fluoresced in the Earth's atmosphere.
10
4. Jupiter: Auroral Emissions
Auroral X-rays from Jupiter were first detected by Einstein observatory
in 1979,
2
and later studied by ROSAT observations.
21
,
22
The pre-Chandra
understanding of Jovian auroral X-rays was that these emissions are mostly
line emissions resulting from recombination and charge exchange transitions
in high-charged states of S and O ions precipitating from inner (
∼
8-12
R
J
)
region of the magnetosphere.
1
,
3
,
21
-
24
The Chandra observations of Jupiter in December 2000
25
and February
2003
26
have revealed that: (1) most of Jupiter's northern auroral X-rays
come from a “hot spot” that is fixed in latitude and longitude and located