Geoscience Reference
In-Depth Information
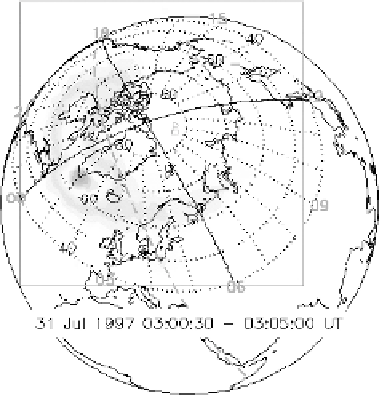
Fig. 1. Auroral X-ray image of the Earth from the Polar PIXIE instrument (energy
range 2.81-9.85 keV) obtained on July 31, 1997. The box denotes the PIXIE field-of-
view. Solid black lines represent the noon-midnight and dawn-dusk magnetic local time
meridians, while red dashed line represents the day/night boundary at the surface. The
grid in the picture is in geomagnetic coordinates and the numbers shown are magnetic
local time (from PIXIE; courtesy N. Østgaard).
a spatial resolution of
700 km. PIXIE data showed that the substorm
X-rays brighten up in the midnight sector and have a prolonged and delayed
maximum in the morning sector due to the scattering of eastward-drifting
electrons.
13
Statistically, the X-ray bremsstrahlung intensity is largest in
the midnight substorm onset, is significant in the morning sector, and has
a minimum in the early dusk sector.
10
During the onset/expansion phase of
a typical substorm the electron energy deposition power is about 60-90 GW,
which produces around 10-30 MW of bremsstrahlung X-rays.
17
While harder X-ray emissions from electron bremsstrahlung are well
known in the terrestrial aurora,
9
-
15
surprisingly, there were no searches for
emissions at auroral latitudes at energies
<
2 keV until recently. Northern
auroral regions of Earth were imaged using the high-resolution camera
(HRC-I) of the Chandra X-ray observatory at ten epochs (each
∼
20 min
duration) between mid-December 2003 and mid-April 2004,
18
to search
for Earth's soft (
<
2 keV) X-ray aurora. The first Chandra soft X-ray
observations of Earth's aurora showed that it is highly variable — some-
times intense arcs (Fig. 2), other times multiple arcs, or diffuse patches, and
at times absent.
18
∼
In at least one of the observations an isolated blob of