Geoscience Reference
In-Depth Information
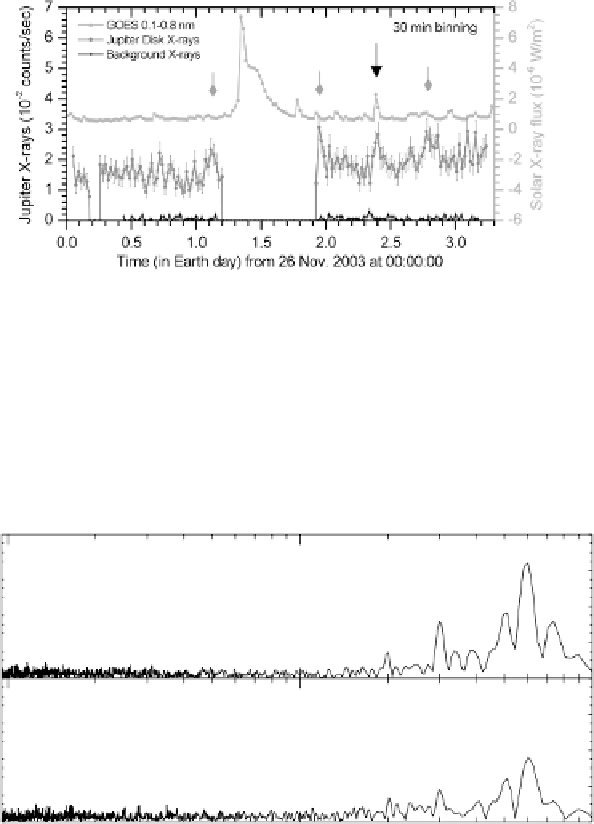
Fig. 4. Comparison of 30-min binned Jupiter disk X-rays (middle curve) with
GOES
10 1.5-12 keV solar X-ray data (top curve). The X-ray background lightcurve is at the
bottom, just emerging from zero level. The Jovian X-ray time is shifted by
4948 s
to account for light travel time delays. The gap between 1.2 and 1.9 days (when the
largest solar flare of this period took place!) is due to
XMM-Newton
perigee passage.
The big, triangular-head arrow at 2.4 days refers to the time of the largest solar flare
visible from both Earth and Jupiter, which has a clear matching peak in the Jovian
lightcurve. Smaller, diamond-head arrows mark peaks in the Jupiter lightcurve which
could correspond to solar flares occurring on the western (Earth-hidden) side of the Sun.
−
0.8
N spot
0.6
0.4
0.2
0.0
0.8
S spot
0.6
0.4
0.2
0.0
0.8
Equator
0.6
0.4
0.2
0.0
10
100
1000
Period (min)
Fig. 5. Amplitude spectra generated from the lightcurves in Fig. 3: Jupiter's 10 h rota-
tion period is clearly detected in the North and South aurorae, but not in the low-latitude
emission; there is no evidence for periodic or quasi-periodic variability at short timescales.