Geoscience Reference
In-Depth Information
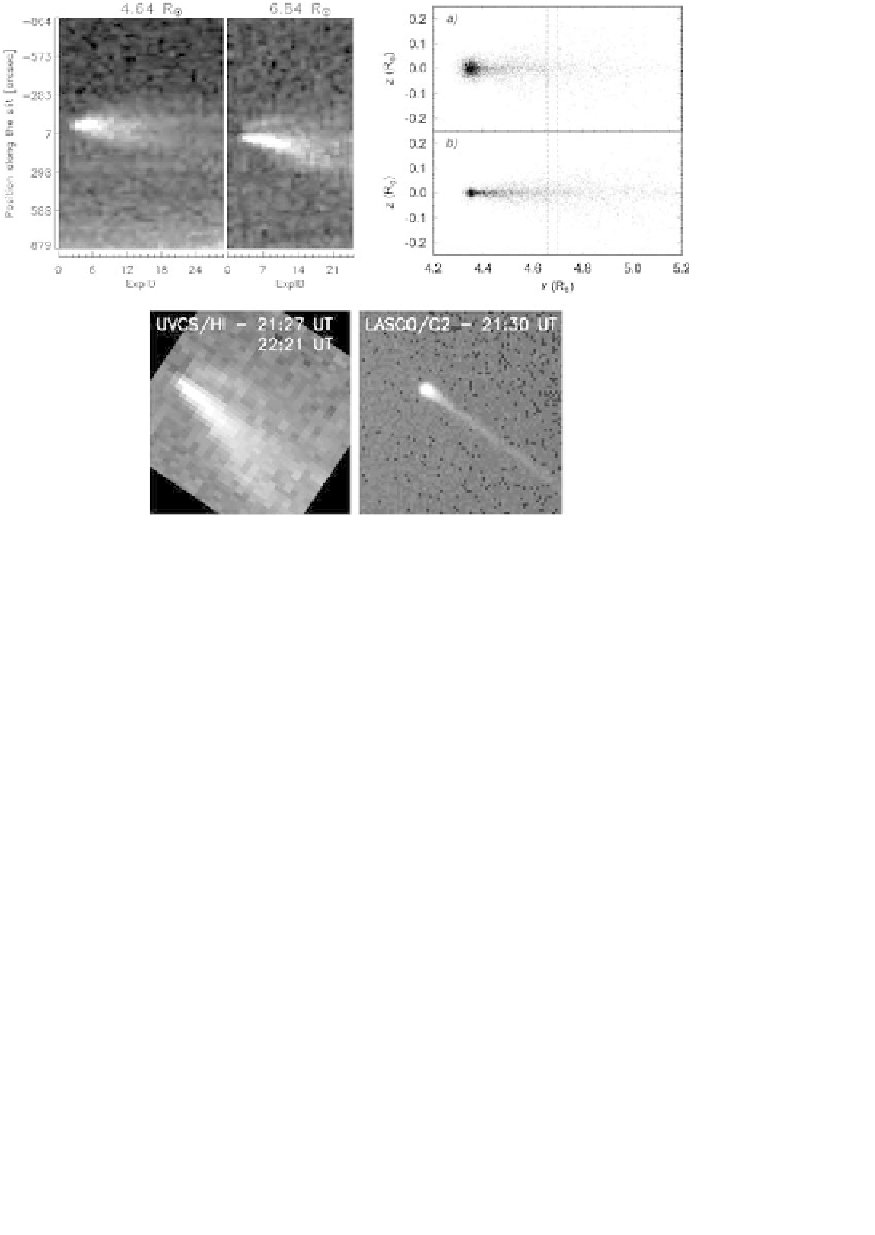
Fig. 4. Top left: composite images of the C/2002 S2 Ly
α
tails at 4.64 and 6.84 R
(coronal background emission not subtracted). Top right: the simulated distribution of
the H atoms with two different assumption on the wind speed for the comet crossing
at 4.64 R
(dashed line represents the UVCS slit FOV). Bottom: a comparison between
the C/2002 S2 Ly
α
image (left) and the white light image (right) from LASCO data.
A first alternative explanation could be that the observed tails both
originate from the interaction of cometary dusts with the coronal protons,
as described in Sec. 4. However, we notice that, opposite to what happens
for the C/2001 C2 observation, during the C/2002 S2 observations the
orbital plane was seen edge-on. In general, the ion and dust tails or tails
of dusts ejected at different times have a different inclination, but lie on
the orbital plane. Hence, in this interpretation, we should expect to see two
tails superposed along the line of sight, and this is not the case. Moreover, a
comparison between the Ly
α
image reconstructed from UVCS data and the
white light image at the same time from LASCO (Fig. 4, bottom panel),
shows a single tail lying in between the two Ly
α
tails. Because, as it is well
known, white light emission is due to the scattering from the dust grains,
this may lead us to consider a separate origin for the C/2002 S2 Ly
α
tails
and the dust tail.