Geoscience Reference
In-Depth Information
with the SWAS measurements at 0.05 hPa (
∼
49 km). The temperature at
25 km) is roughly consistent with the SWAS measurements
3
before the onset of the dust storm, and rises in both the observations
and simulations. However, in the model, the temperature increase owing
to the global dust storm is 20-30 K lower than in the measurements. The
model result in Fig. 3(b) was smoothed over 8.5
◦
of
L
s
to match the
SWAS data which were reportedly averaged over the same time interval. At
0.05 hPa the temperature time series is almost consistent with the observa-
tions during the global storm, although is
0.5 hPa (
∼
∼
10 K colder before the global
dust storm (see Fig. 3(b)). At 0.005 hPa (
73 km), the model does not
produce the temperature increase with the onset of the storm. This is con-
sistent with the SWAS measurements, although the simulated temperature
is generally
∼
∼
10 K higher.
4. Discussion
We compare the global mean atmospheric and surface temperatures simu-
lated with the recently developed Martian GCM
5
with those observed by
the Earth-orbiting submillimeter instrument (SWAS). The model includes
the parametrization of the absorption, emission, and scattering of the solar
and infrared radiation by the atmospheric dust.
The model reproduces a moderate atmospheric temperature inversion
below 30 km around
L
s
= 215
◦
, as was measured by SWAS (Gurwell, per-
sonal communication) and observed with MGS-TES during the dust storm
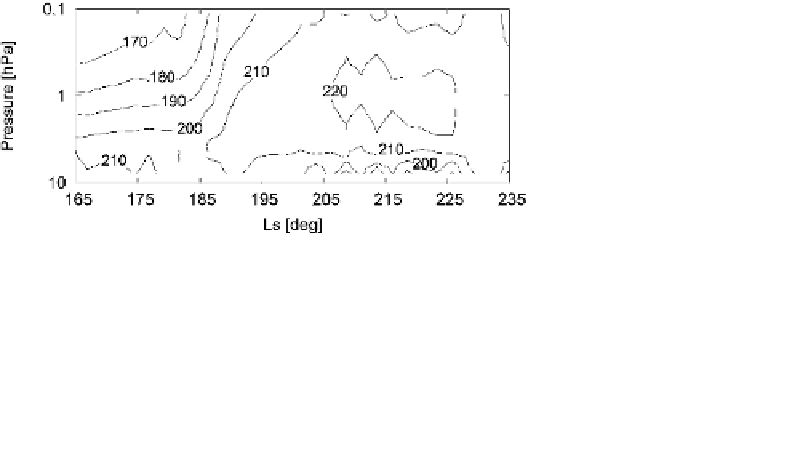
of 2001. The global-mean daytime (local time 14:00) atmospheric temper-
ature from MGS-TES is shown in Fig. 4. The temperature inversion is
clearly seen there around
L
s
= 215
◦
. The simulated time series of the surface
Fig. 4. Vertical distribution of the daytime (local time 14:00) global-mean atmospheric
temperature measured by MGS-TES for the same period as in Fig. 3.