Geoscience Reference
In-Depth Information
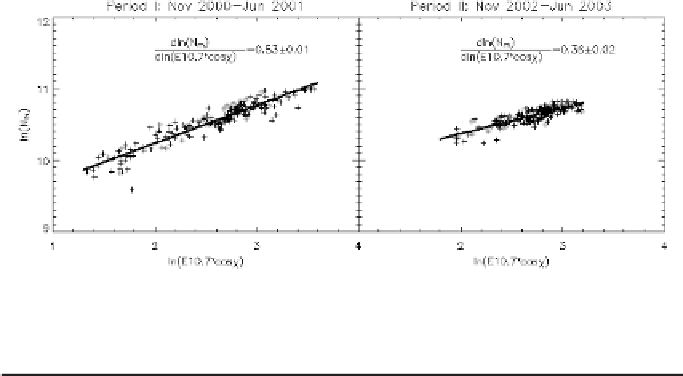
Fig. 4.
The solar radiation dependence of the secondary peak density for both periods.
Table 1.
Summary on the data sets of the two periods.
Period
(Number of profiles)
Date
L
s
(
◦
) A
◦
)LAT
◦
N)
Period I (1572)
November 1, 2000-June 6, 2001
70-174
71-87
63-86
Period II (1805)
November 1, 2002-June 4, 2003
89-198
71-84
60-85
The dependence of the ionospheric peak density on the solar radiation
as well as SZA under a photochemical equilibrium is normally described as
(e.g., Ref. 10)
d
ln
N
m
d
ln(
E
10
.
7
=
k.
(7)
×
cos
χ
)
For an ideal Chapman-
α
layer
k
is the same as in Eqs. (1) and (2) and
expected to be 0.5.
Figure 4 shows the dependence of
N
m
on E10.7* and SZA during both
considered periods. The correlation between the solar radiation and the
ionospheric peak density is convincing. For period I,
k
=0
.
53 and period II,
k
=0
.
36, both close to the value in Eqs. (3)-(6) but still deviate from 0.5.
However, the discrepancy between the two periods is noteworthy. As
shown in Table 1 and Fig. 3,
L
s
and SZA variations as well as the occultation
locations are quite similar for both periods, the systematical disagreement
between these two periods needs further discussion.
4.
Discussion and Summary
Total 3,377 Martian ionospheric electron density profiles measured by
MGS/RS during period I (from November 1, 2000 to June 6, 2001) and