Geoscience Reference
In-Depth Information
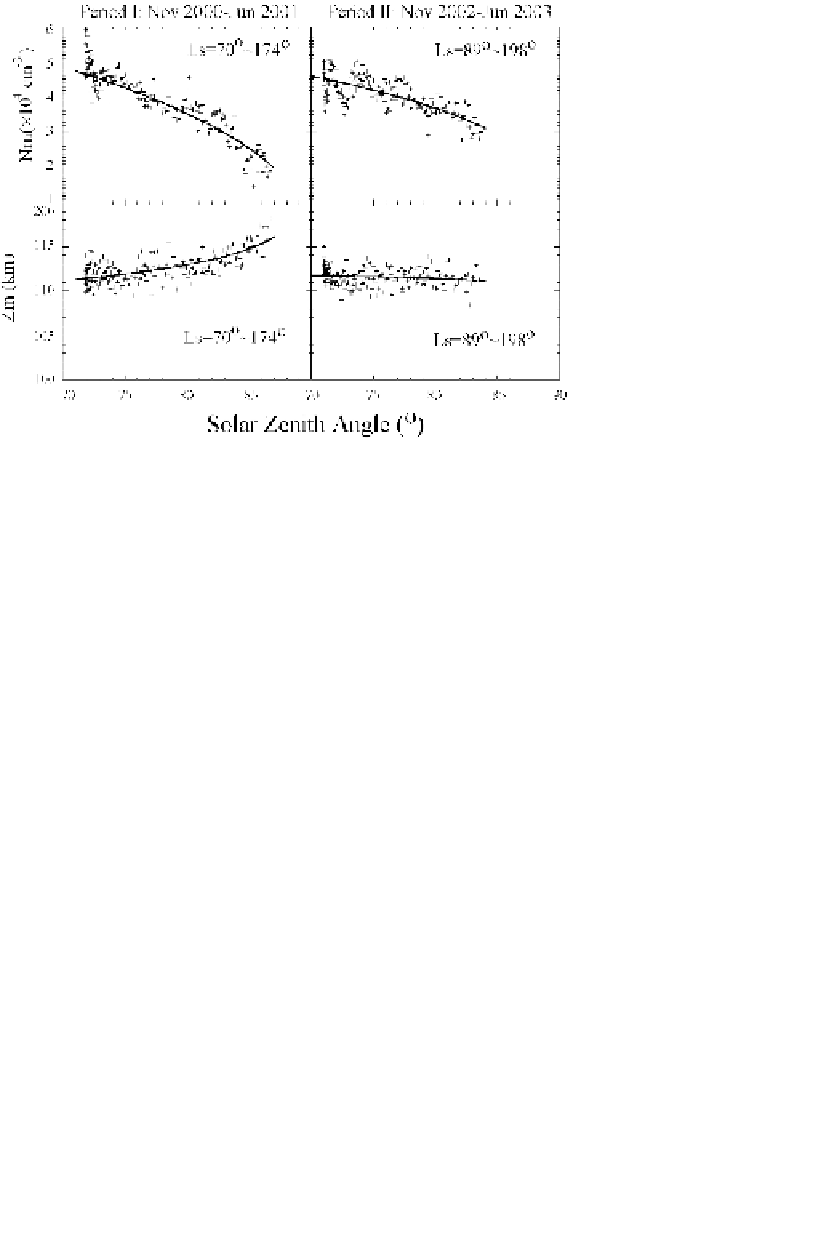
Fig. 2. The solar zenith angle dependence of the peak density and the peak height of
the secondary electron density maximum. The solid curves are best fit by the expression
indicatedineachpanel.
and
H
is the mean neutral scale height in the upper atmosphere, the SZA
dependence of the secondary layer can be described as
10
4
cos
0
.
48
χ,
N
m
(period I) = 8
.
1
×
(3)
10
4
cos
0
.
32
χ,
N
m
(period II) = 6
.
5
×
(4)
z
m
(period I) = 108 + 2
.
6lnsec
χ,
(5)
z
m
(period II) = 112
−
0
.
5lnsec
χ.
(6)
It is found that in both periods the apparent behaviors of the secondary
layer depart from an ideal Chapman-
α
layer for which
k
=0
.
5, while
k
=
0
.
57 was obtained for the primary layer.
6
And most noticeable is that the
peak height during period II is nearly constant with the increase of SZA.
It is quite different from the general behaviors of the primary layer as well
as that of the secondary layer during period I.
Figure 3 shows the variations of the secondary peak density and height,
the corresponding E10.7* and SZA with the solar longitude (
L
s
,whichcan
be used as the proxy of time herein), where E10.7* is the solar E10.7 index
at the Mars orbit derived from the Earth orbit value after two corrections.
The time shift caused by the angle of Earth-Sun-Mars can be corrected by