Geoscience Reference
In-Depth Information
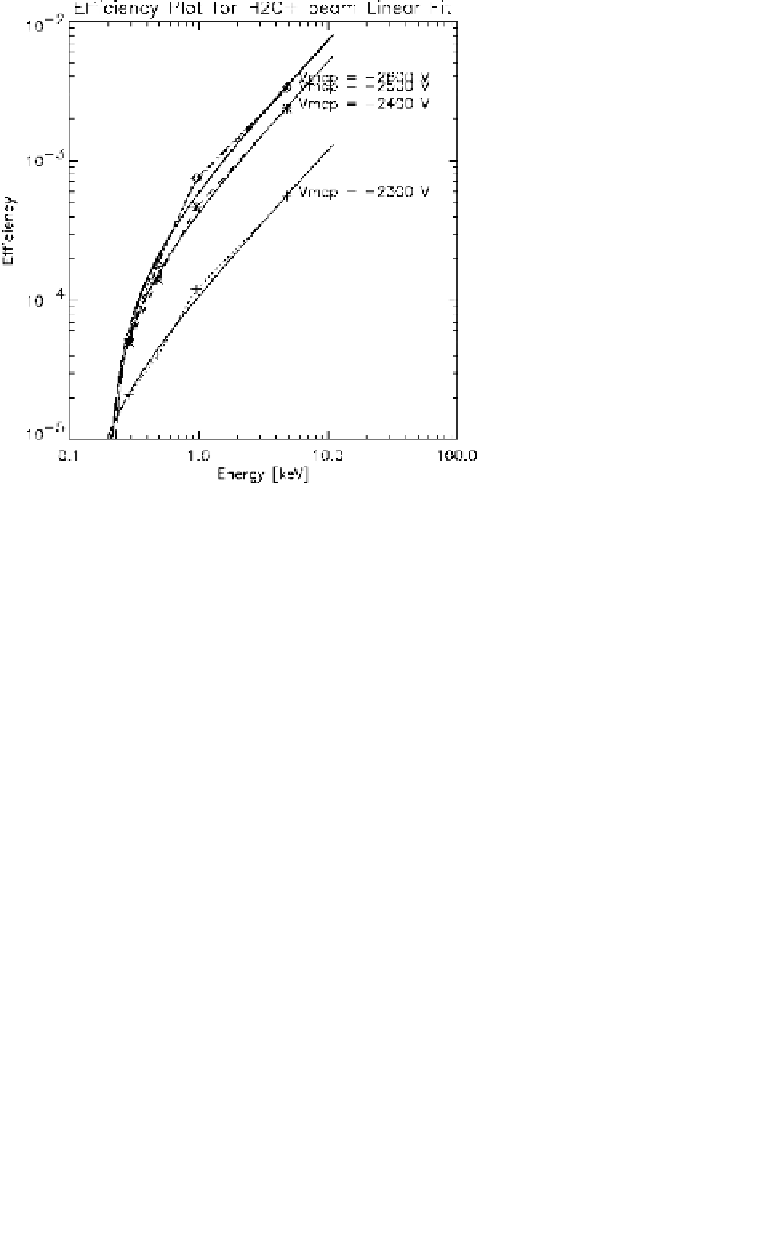
Fig. 11. The NPI e
ciency to H
2
O
+
ions as a function of energy from on-ground
calibrations. The different curves are for different MCP bias voltages. The in flight MCP
bias voltage for the time period discussed here was
−
2400 V.
We also show the NPI energy response from calibrations in Fig. 11.
Given an inter-sector normalized count rate,
v
i
, as defined in Table 2, we
can estimate the incoming flux of neutrals as
f
v
i
/
(
G
)(cm
−
2
/sr/s),
≈
where the geometrical factor
14
G
10
−
3
(cm
2
sr), and
is the energy-
dependent eciency from Fig. 11, e.g., for 1 keV neutrals we have
≈
2
.
7
×
≈
10
−
4
, so a count rate of one per second would correspond to a flux of
4
×
10
5
(cm
−
2
/sr/s).
2
×
References
1. S. Barabash, R. Lundin, H. Andersson, J. Gimholt, M. Holmstrom,
O.Norberg,M.Yamauchi,K.Asamura,A.J.Coates,D.R.Linder
et al.
,in
Mars Express: The Scientific Payload
, ed. A. Wilson (ESA Special Publica-
tion, SP-1240, 2004), pp. 121-139.
2. S. Barabash, R. Lundin, T. Zarnowiecki and S. Grzedzielski,
Adv. Space Res.
16
(1995) 81-86.