Geoscience Reference
In-Depth Information
package. The raw data was processed using
. The data and
geometry information was merged into a text file that subsequently was
read into Matlab for further processing and display. The software is avail-
able from the authors upon request.
pkttool-1.103
3. Observations
Using the inter-sector normalization described in the previous section, we
can compute skymaps for the NPI deep eclipse data that show the average
count rate as a function of look direction ecliptic longitude and latitude.
For each one-second observation, we first do an inter-sector normalization,
according to Table 2, of the counts from each sector, then deposit the
count in the cell that corresponds to the sector's boresight direction, and
also accumulate the observation time on the grid. This is done for all the
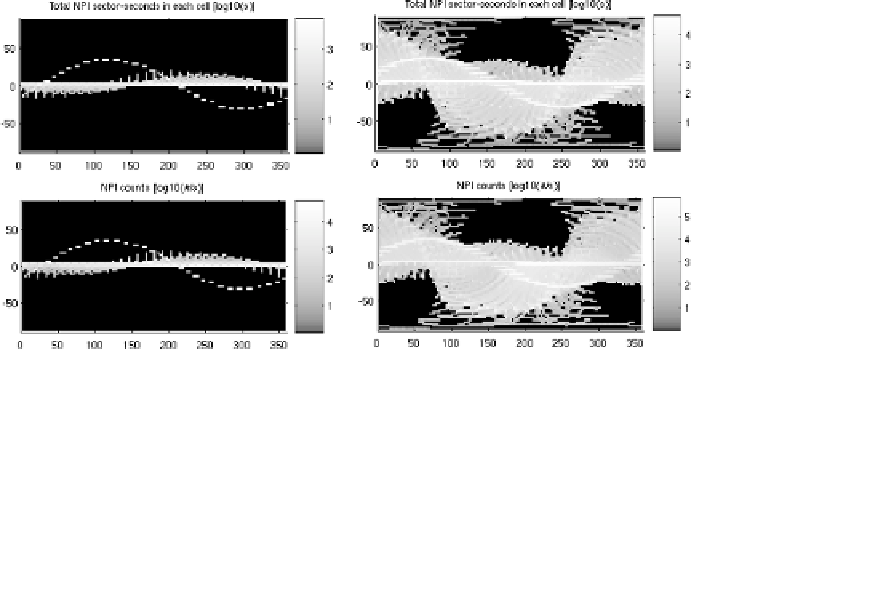
data to be included. In Fig. 5, we show the logarithm of the total time and
counts accumulated for each cell on the longitude-latitude grid. Finally, by
dividing the accumulated counts in each cell by the total observation time
we get an average count rate.
Such sky maps for 2004 and 2005 are shown in Fig. 6. In 2004, we note
signals from the general Mars direction (see Fig. 4 for Mars' approximate
location). These are probably charge exchange ENAs from the Mars-solar
wind interaction and UV scattered and refracted in Mars' atmosphere. In
Fig. 5. Logarithmic sky maps of total sector time for each cell (top) and total number
of counts (bottom) for NPI eclipse observations in 2004 (left) and 2005 (right). The
coordinate system is ecliptic with longitudes on
x
-axes, and latitudes on
y
-axes, and the
grid is 128
×
64 cells. Note the different color scales. Black denotes no coverage.