Geoscience Reference
In-Depth Information
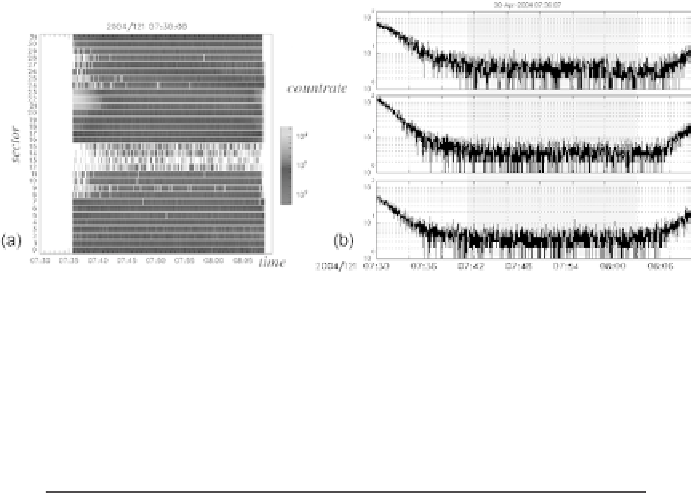
Fig. 2. Typical NPI eclipse observation on April 30, 2004, 07:36-08:08. (a) Countrates
for all 32 sectors as a function of time. Sector 31 is the top row and sector 0 at the
bottom. We see the sun set in sector 12 early in the observation, and rise again at the
end of the observation. (b) Countrates for three of the sectors with the deep eclipse
region shaded. The sectors are 21-23 from top to bottom. The
y
-axis scale goes up to
100 counts per second.
Table 1.
Summary of eclipse observations presented in this work.
Number of
Duration of
Mars' ecliptic
Dates
observations
eclipses (min)
longitude (deg)
2004-04-09 to 2004-08-21
259
10-20
102-162
2005-02-14 to 2005-03-31
163
30-60
245-270
NPI FOV plane is in the ecliptic plane. During nadir observations, inertial
observations, and slews, the NPI observes other directions.
To examine the NPI observations in ecliptic coordinates, we would like
to make sky maps where all the sectors contribute. A complication is that
different sectors have different responses to ENAs. Their sensitivity and
background noise levels are different. We can use ground calibration values
to solve this inter-sector normalization problem, but we think that the in-
flight values are slightly different, and that they have changed between 2004
and 2005. Here we use ground calibration values for the sectors' relative
sensitivities, and we compute the noise level (dark currents) for each sector
from observations, as shown and explained in Table 2. The noise level was
estimated by binning the eclipse observations in 60 s bins, and the smallest
average count rate was chosen as a noise level estimate for each season. It
would have been preferable to also do an in-flight estimate of the the sectors'
relative sensitivities, and attempts has been made, e.g., to identify times
when different sectors look in the same direction close in time, but no good