Geoscience Reference
In-Depth Information
Region
1
Region
2
Gobi
Sand
Loess
Mix e d
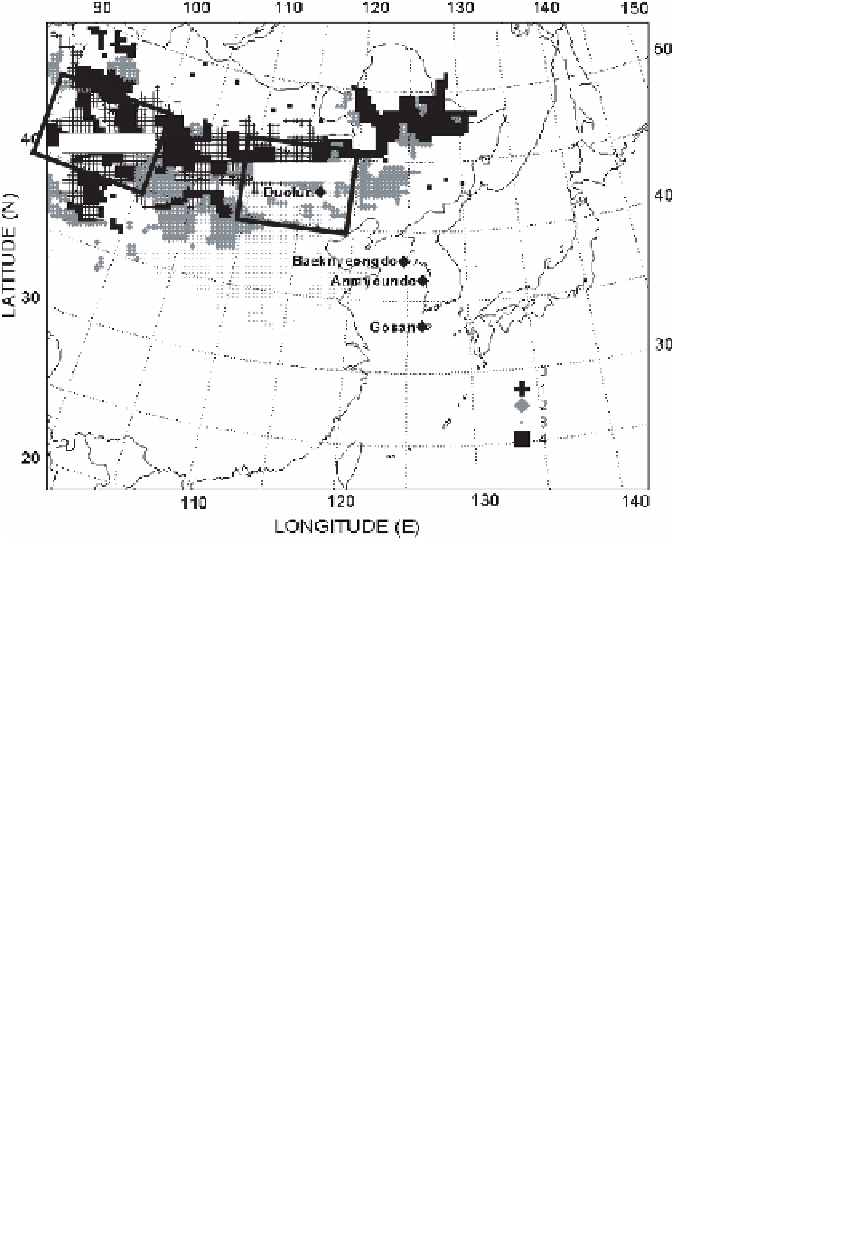
Fig. 1. The model domain and Asian dust source regions (++ Gobi,
Sand,
Loess
and
Mixed). Precipitation and vegetation index analyzes are given in Regions 1
and 2. Several PM
10
monitoring sites in Korea are also shown.
where
F
a
is the dust flux from the surface (g/cm
2
/s
1
),
u
∗
the friction
velocity,
u
∗
t
the threshold friction velocity,
f
i
the fractional coverage of
vegetation type
i
in the dust-source grid and
R
i
is the reduction factor
of vegetation type
i
given in Table 1, which is derived from the advanced
very high-resolution radiometer (AVHRR) in the source region, and
α
is a
constant that is determined by the soil type in the source region.
2
3. Results
Figure 2 shows the time series of modeled PM
10
concentrations averaged
for the layers below 100 m, 100-1500 m and above 1500 m and the observed
PM
10
concentrations at Baeknyeongdo, Anmyeondo and Gosan in South
Korea (Fig. 1) during the simulation period. The start and end time of the
dust event are quite well simulated, indicating that the dust emission values
in the ADAM model are satisfactory. However, simulated PM
10
concentra-
tions for the period of March 8-15, 2004 are highly overestimated compared