Geoscience Reference
In-Depth Information
Fig. 4.
As in Fig. 3, except for the anthropogenic aerosol.
3.3.
Estimation of aerosol direct radiative forcing
Vertical profiles of temperature, pressure and H
2
O mixing ratio obtained
from the MM5 simulation and those of ozone and CO
2
mixing ratios from
the CRM model are used as the initial profiles for CRM. The aerosol direct
radiative forcing is obtained as the difference in shortwave net radiative
fluxes at TOA and the surface between CRM simulations with and without
aerosol mass loadings simulated by the aerosol dynamic model and ADAM.
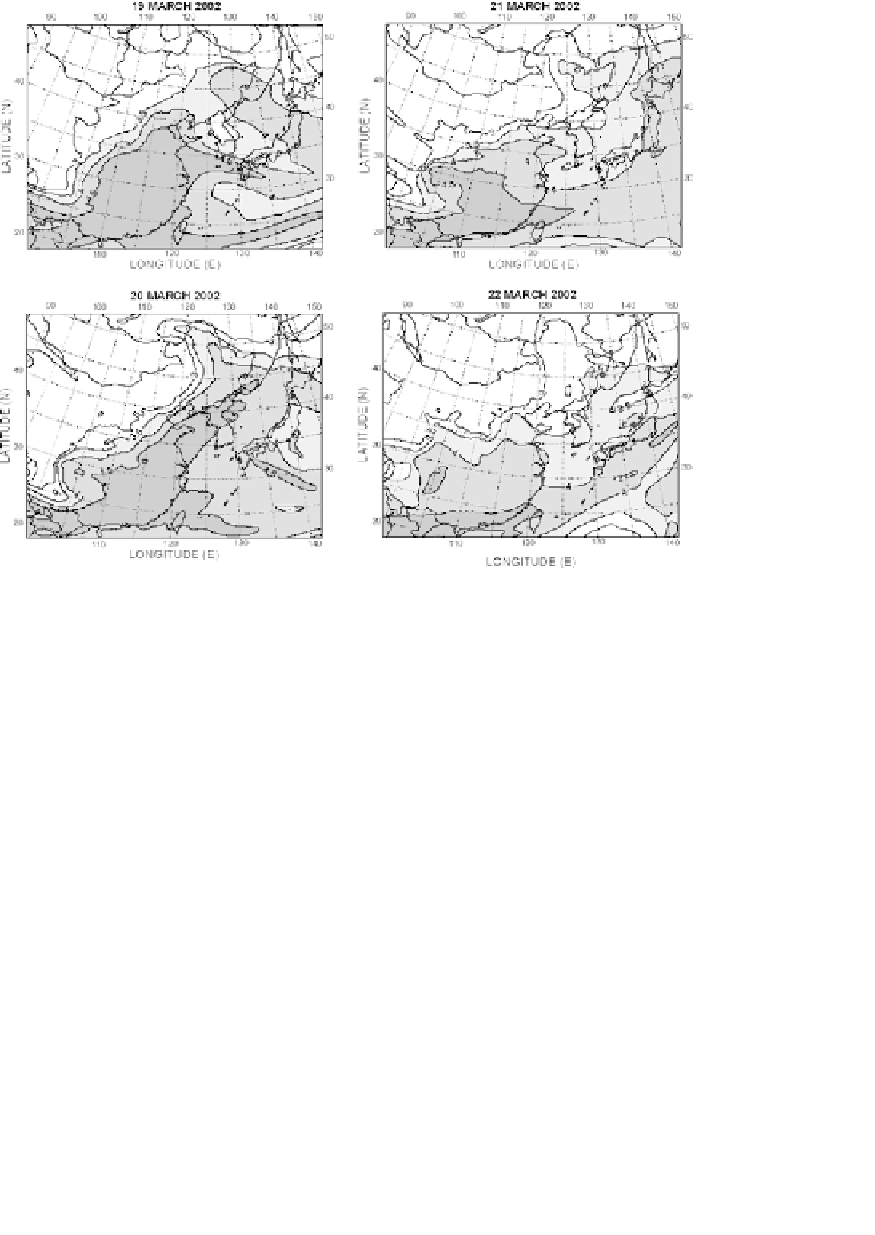
The spatial distribution of the daily mean radiative forcing at the sur-
face due to total aerosols (Asian dust aerosol + anthropogenic aerosol)
indicates that there are two maxima with values greater than -20 W/m
2
in
the northern central part of China and the southeastern part of China on
March 19, 2002 (Fig. 5). The former is attributed to the Asian dust aerosol
whereas the latter is due to the anthropogenic aerosol. As time progresses
the dust clouds originating from southern Mongolia and Inner Mongolia are


