Geoscience Reference
In-Depth Information
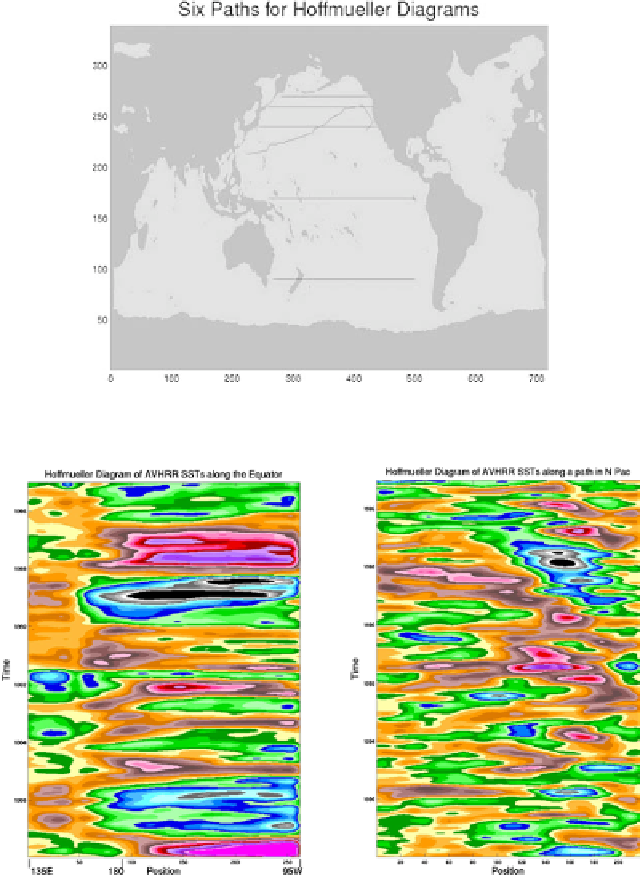
Fig. 1.
Six paths along which Hoffmueller diagrams were analyzed.
Fig. 2. Hoffmueller diagram of the AVHRR SST deviations for the path along the
equator and the path in the North Pacific, as defined in Fig. 1.
along the equator. The colors in Fig. 2 represent temperatures deviated
from the modeled seasonal SSTs. The values of the deviation range from
−
0
.
5
◦
C for blue and green, 0
.
0
◦
C
for yellow, 0
.
5
◦
C for brown, 1
.
0
◦
C for pink and red, to 1
.
5
◦
C for purple.
Both 1987 and 1997-1998 El Nino events as well as the 1984-1985, 1989 and
1
.
5
◦
C for black color,
1
.
0
◦
C for gray,
−
−