Geoscience Reference
In-Depth Information
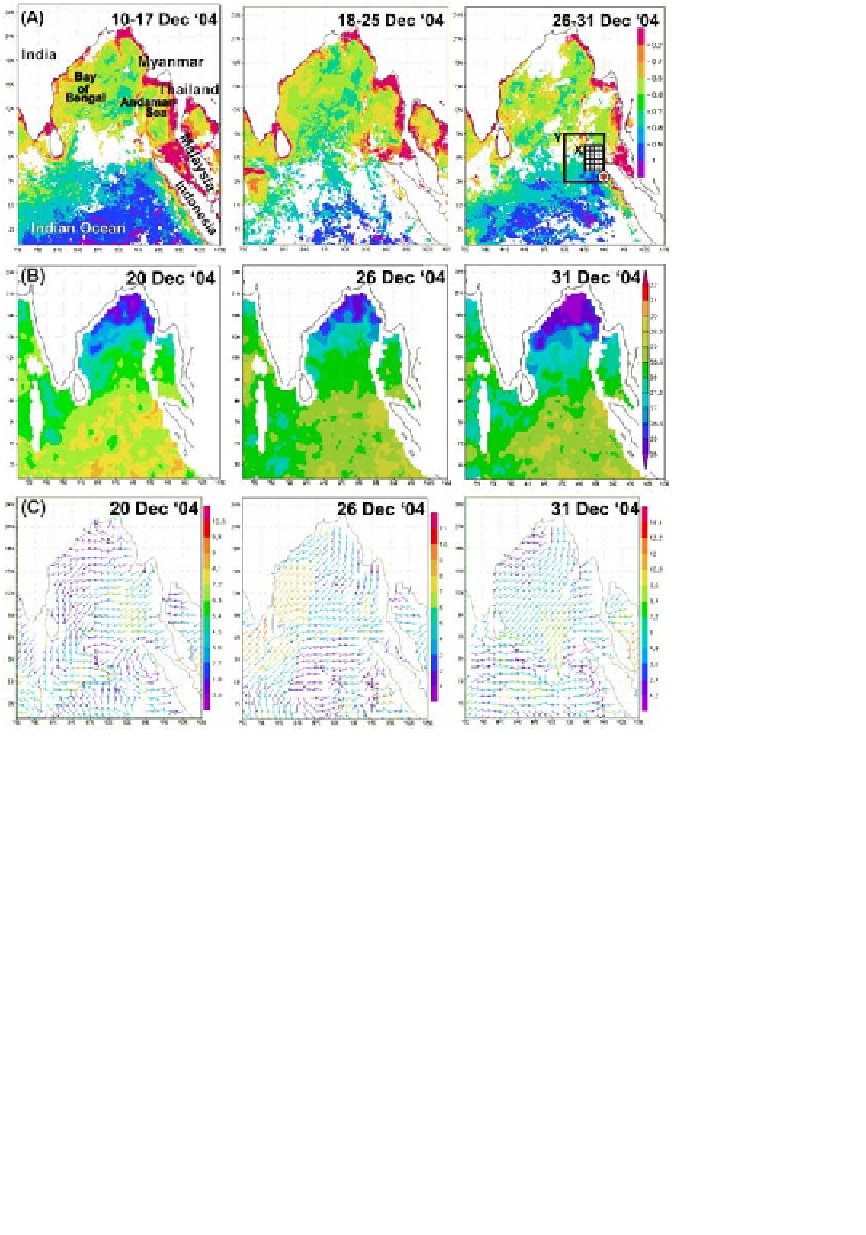
Fig. 1. (A) Distribution of Chl-
a
(mg m
−
3
) in Indian Ocean (December, 2004). The epi-
center of earthquake is marked with red star on December 26-31, image. Boxes (X & Y)
near the epicenter denote the regions for which time series data of Chl-
a
and SST were
examined. (B) Variations in Sea Surface Temperature (SST) ranged between 25 and
32
◦
C. (C) Wind speed and direction. The intensity of wind (m/s) represented by color
bar in each panel, increased from 0.9-10.8 (December 20) to 1-11 (December 26) followed
by 1.2-14.4 (December 31).
Daily information on level-3 QuikScat sea surface winds (m/s) (res-
olution 25 km) was obtained via the Physical Oceanography Distributed
Active Archive Center (PO.DAAC) of the Jet Propulsion Laboratory,
NASA (http://podaac.jpl.nasa.gov).