Geoscience Reference
In-Depth Information
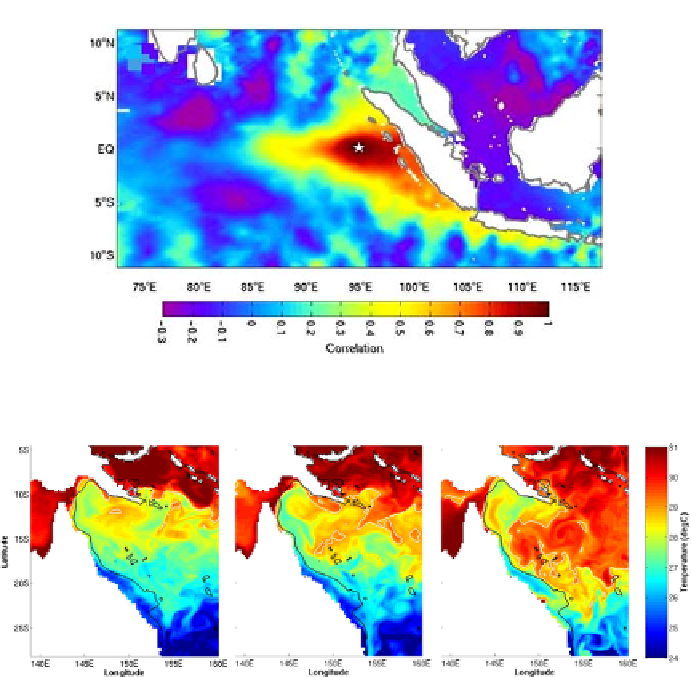
Fig. 2. Horizontal spatial correlations of sea surface height anomalies based on an
ensemble of modelled states (a) Tasmania, (b) Indonesia (adapted from Ref. 8).
Fig. 3. BRAN surface temperature (10 m) in the Coral Sea for the January 6, 2000-
2002. The 29 degree isotherm is represented by the white contour. The 200 m isobath is
represented by the black contour.
of intraseasonal anomalies derived from a 9-year spinup integration of the
ocean model without data assimilation. An example of the spatial struc-
ture of the ensemble covariances is shown in Fig. 2 for a location, indicated
by the star, situated off Indonesia with the immediate surroundings. This
example appears to represent the covariability associated with an equato-
rial Kelvin wave and its coastal extension (the positive correlations); and a
Rossby wave pair (the negative correlations near 80
◦
E) associated with the
equatorial wave guide of the Indian Ocean.
3.3.
Ocean reanalysis
OFAM and BODAS have been applied to construct an ocean reanalysis for
the period 1992-2005. The BLUElink
>
ReANalysis (BRAN)
7
uses delayed