Geoscience Reference
In-Depth Information
02550
100
150
200
Miles
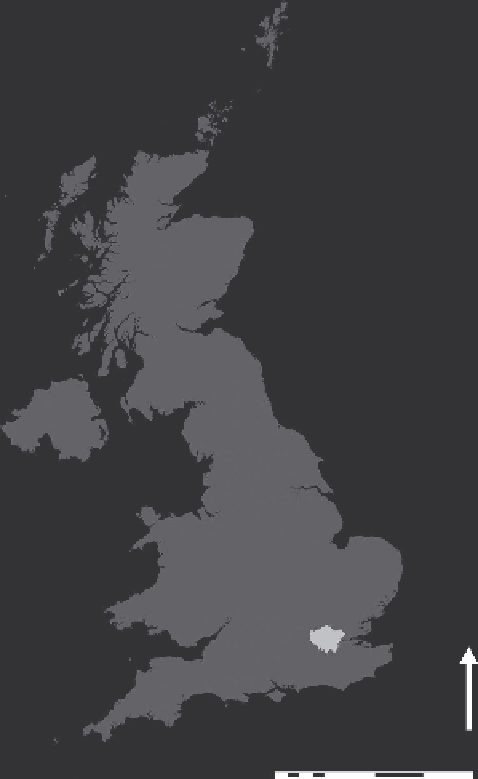
FIGURE 3.2
Location and extent of Greater London in the United Kingdom. (From OS Boundary-Line
Great Britain and London [Shapefile geospatial data], Coverage: Great Britain, Ordnance Survey, GB. Using:
EDINA Digimap Ordnance Survey Service, http://edina.ac.uk/digimap, Downloaded: 2013.)
A related issue in classification is the standardisation technique used, and different solutions
may be appropriate depending on the structure of the underlying data. Flexibility in weighting
nonetheless has an impact on the time it takes to compute a clustering solution across a range
of algorithms. As such, Adnan (2011) reports on the efficiency of a number of established clus-
tering algorithms by using three different variable standardisation techniques which include
z
-scores, range standardisation and principal component analysis (PCA). An extensive compari-
son of Clara, genetic algorithms and
k-
means identifies that
k
-means remains a strong performer
for producing the finest levels of geodemographic classifications, although algorithm refinement
to improve computation time remains a task for future GC research. To this end, research (e.g.
Ding and He 2004) has suggested that PCA projects to the subspace where the global solution of
k
-means clustering lies and thus guides
k
-means clustering to find a near-optimal solution. Using
data for Greater London (Figure 3.2), Adnan (2011) has tested this hypothesis using the variables
that comprise the 41 variable output area (geodemographic) classification (OAC) (Vickers and
Rees 2007), compared with the 26 principal components that account for 90% of the variance in
the same data set. Figures 3.3 and 3.4 show the close correspondence between the results. Running

