Geoscience Reference
In-Depth Information
(a)
(b)
(c)
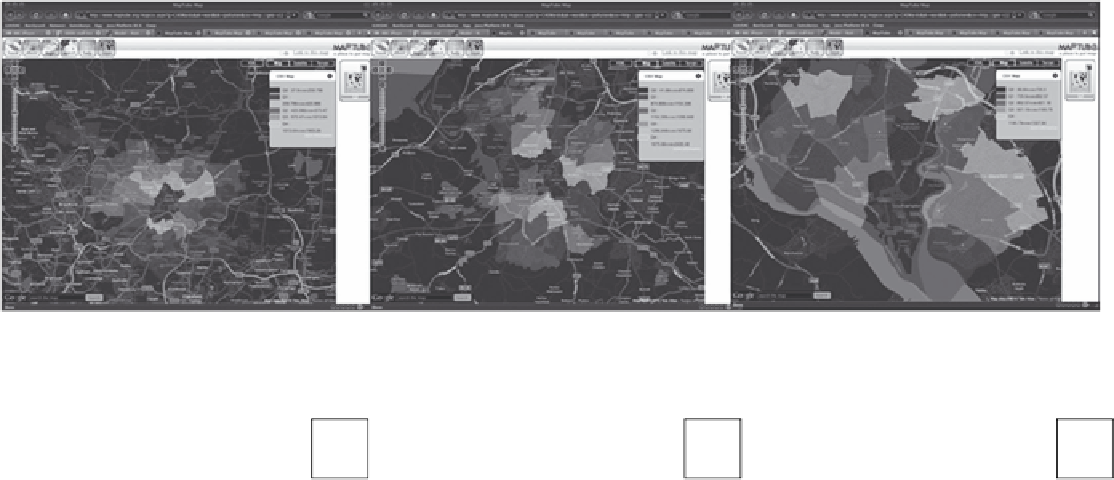
Base indicators
Projection indicators
Scenario indicators
160
140
120
100
80
60
40
20
0
250
200
150
100
50
0
200
180
160
140
120
10
80
6
40
20
0
Leeds
Leeds
Leeds
Soton
Bristol
Soton
Bristol
Soton
Bristol
Pollution Congestion Trip cost
Road
accidents
Pollution Congestion Trip cost
Road
accidents
Pollution
Congestion Trip cost
Road
accidents
(d)
(e)
(f)
FIGURE 10.4
Pollution in (a) Leeds, (b) Bristol and (c) Southampton (Soton). Indicators/externalities for the three cities: (d) baseline, (e) projection and (f) scenario.