Geoscience Reference
In-Depth Information
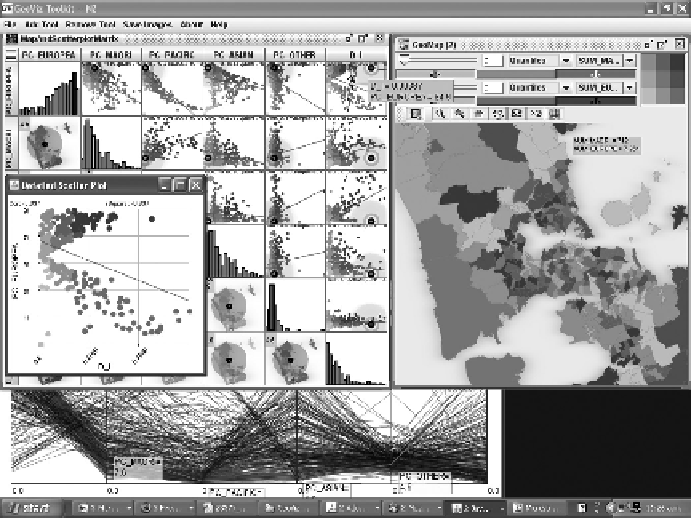
FIGURE 5.5
A set of coordinated displays inside of
GeoViz Toolkit
. The matrix at top left shows scatterplots
and bivariate maps contrasting the pairwise comparison of six ethnicities for the greater Auckland region of
New Zealand (and also a histogram for each variable's distribution). These same six variables also appear in
the parallel coordinate plot at bottom left. A single selected suburb is highlighted in all of the displays, since
any selection event is coordinated between them.
principles. But more complex motifs such as Chernoff* faces (Chernoff, 1973) and landscape visu-
alisations (Rheingans and Landreth, 1995) are also possible and are used sometimes. The human
visual system appears to be specifically
tuned
for interpreting faces and landscapes, we learn early
in our personal development to interpret facial expressions such as anger and boredom, and we also
learn from experience how to
read
the topography of our environment. So perhaps these are useful
metaphors by which to convey other kinds of data? Dorling (1994) shows some visually compelling
examples of Chernoff faces used in GeoViz to highlight trends in political and social conditions in
the form of a cartogram. Some excellent examples of the power of the landscape metaphor used in
InfoViz are provided by Dürsteler (2013).
5.3.2.2 Divide and Conquer versus Compositional Approaches
When dealing with highly multivariate data, we require to scale beyond searching for patterns
across a handful of data attributes that might be clearly visualised in a single graph, such as a
scatterplot, to tens or even hundreds of attributes. Two approaches are feasible:
small multiples
and
compositional
- both described here. Small multiples decompose the problem into a num-
ber of independent, but usually linked displays, such as a matrix of scatterplots (MacEachren
et al., 2003). One clear advantage of this approach is that no prior assumptions need be made
about which variables to graph - all are graphed and the search begins from the premise that
pairwise correlation across all data attributes (e.g. in scatterplots and maps) is a useful first
*
A Chernoff face is created by combining several simple glyphs (e.g. circles for eyes, a triangle for a nose) into a compound
cartoon-like
face
. The glyphs are used to visually encode several data attributes, such that a single face can encode per-
haps 10 or more variables.