Geoscience Reference
In-Depth Information
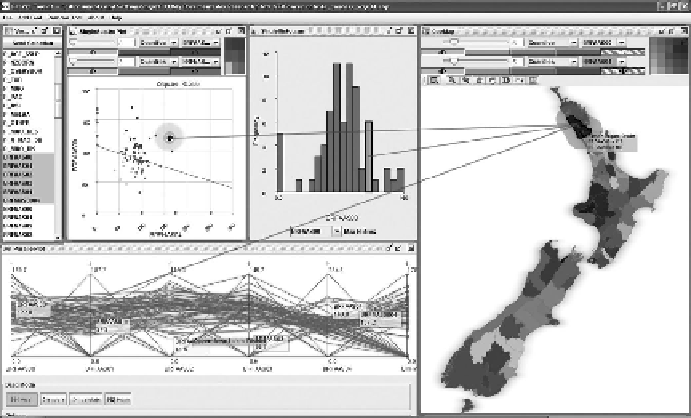
FIGURE 5.2
An initial exploration of breast cancer incidence in New Zealand. The display on the right is
a bivariate choropleth map, made by combining two data variables (cancer rates for two different years). The
parallel coordinate plot at bottom left shows how the cancer rate varies over 5 years for each region. The his-
togram (middle top) shows the distribution of values for just one variable and the scatterplot (top left) graphs
two variables together (the same two as shown in the map). Note the leader lines that connect values across all
the displays for the region that is currently selected (the Kaipara District of North Island).
5.2.1 e
xPloratory
V
iSualiSation
, V
iSual
d
ata
M
ining
, k
nowledge
d
iScoVery
Data can tell many stories; a comprehensive geographical dataset contains a huge wealth of dif-
ferent relationships, both within and between the different layers or themes. The term exploratory
visual analysis (EVA) was established in the early 1990s, with the goal of presenting data to a user
in such a way that relationships and structure contained therein are made apparent (e.g. Tukey, 1977;
Cleveland and McGill, 1988; Monmonier, 1990). The recognition of some underlying pattern or
structure is known colloquially as visual
pop-out
. For pop-out to occur, the target must be identifi-
able via the combined visual stimulus produced from the presentation of the underlying data, which
implies that the stimulus is not shared with any distracters, that is, irrelevant patterns or structures
that produce a similar response in the observer. Simply put, visualisation tools designed for discov-
ery activities need data presentation strategies that lead to pop-out.
EVA is one method in a larger arsenal for performing data mining or knowledge discovery that
could be grouped under the heading of exploratory data analysis (EDA) or data mining and knowl-
edge discovery (Fayyad et al., 2002; Miller and Han, 2009). Non-visual approaches to exploration
and data mining attempt to recognise or discover knowledge by computing the strength of relation-
ships within and between layers of data (e.g. using covariance or entropy measures), possibly distill-
ing out some sort of statistical model as a result. They are usually computer-intensive. Haslett et al.
(1991) describe some early interactive tools for identifying statistical anomalies in data.
More recently, the term visual data mining has become synonymous with EVA (de Oliveira
and Levkowitz, 2003), and specifically relevant here is that it seems to draw inspiration from the
increasing data complexity and volumes that have also stimulated mainstream data mining, for
example, with the challenge of conveying synoptic overviews of millions of records in limited
visual spaces (e.g. Keim and Kriegel, 1996; Jerding and Stasko, 1998). Keim et al. (2006) provide
an excellent summary of the challenges to be overcome. Compieta et al. (2007) describe the con-
nection between exploratory spatio-temporal data mining and visualisation. Data mining has also
made substantial progress of late but remains hampered largely by the difficulty in integrating the