Geoscience Reference
In-Depth Information
12
12
10
8
6
10
8
6
4
4
46810 12 14 16 18
468 012141618
X
1
X
2
12
10
8
6
12
10
8
6
4
4
468 012141618
468 012141618
X
3
X
4
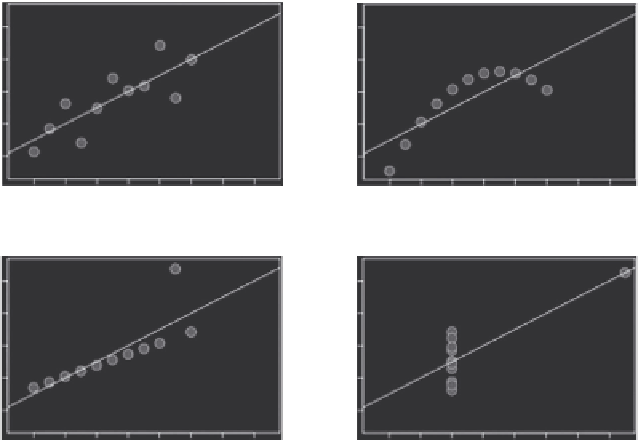
FIGURE 5.1
Anscombe's quartet: four datasets that share many of the same summary statistical properties,
including mean, variance, correlation and linear regression. (Derived from earlier work by Schutz and the R
development core team and is available from Wikipedia's creative commons. This file is licensed under the
Creative Commons Attribution-ShareAlike 3.0 Unported, http://en.wikipedia.org/wiki/File:Anscombe%27s_
quartet_3.svg.)
between x and y
and
linear regression of x and y
. For those interested in verifying this for themselves,
further details can be found here: http://en.wikipedia.org/wiki/Anscombe's_quartet. Sometimes,
relying too much on descriptive statistics can cause us to miss important detail that visualisation
can easily reveal.
Throughout this chapter, I take the view that 'geovisualisation as an analytical toolbox for dis-
covery' refers to the use of GeoViz for exploration activities involving geographical data: to discover
the unknown or to better understand the complex distributions and patterns within the geographical
datasets we now routinely assemble. And rather like the explorers of the past, these acts of discov-
ery are sometimes conducted across unfamiliar landscapes: in our case, the landscapes are formed
dynamically via the projection of data into a visual form. Of course, GeoViz can also play additional
roles in the research process, for example, to present or to communicate final outcomes arising from
analysis. This kind of use is more aligned with traditional presentational forms of cartography than
with GC, so is not considered here.
In contrast to statistical analysis and machine learning techniques, visualisation of any kind
requires strong support from a human observer, who must engage with - and make sense of - the
visualised data, in order to draw inference. The researcher becomes an active part of the analytical
workflow and plays the dual role of both extracting artefacts of potential interest from the display
('that pattern looks interesting…') and of explaining or contextualising the artefact ('…I wonder
what it means?'). See Section 5.6 for a further description of the kinds of inference that GeoViz
supports.
Visualisation works because of the inherent power and adaptability of the human visual sys-
tem, which can still outperform computer vision systems for many complex visual tasks, such
as the detection of weak correlations in noisy data or the winnowing of many correlations to
those most likely to be useful for later analysis. To be effective, GeoViz must translate patterns
of potential interest in the data to visual symbols in such a way as they become discernible