Geoscience Reference
In-Depth Information
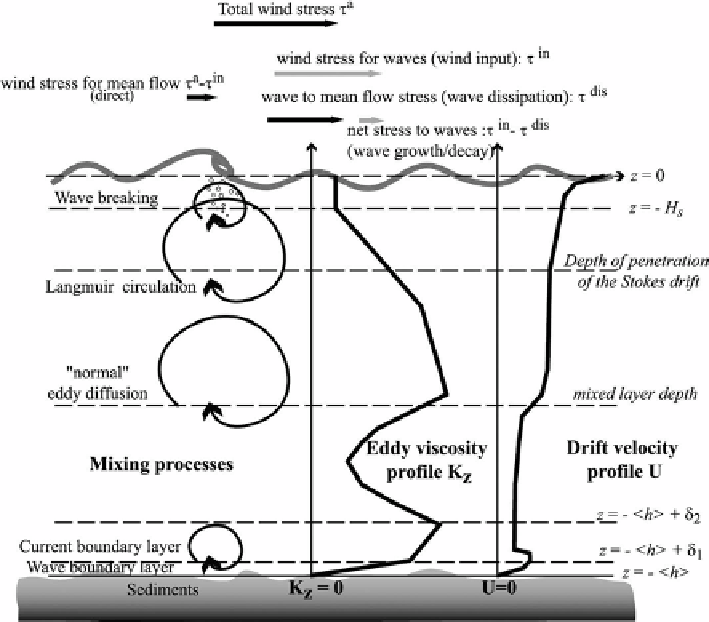
Figure 9.9 Scheme of momentum fluxes and mixing processes which couple waves and currents.
Processes are indicated for horizontally uniform conditions, and possible profiles of eddy viscosity
K
Z
and drift velocity
U
are shown. Figure is reproduced from
Ardhuin
et al.
(
2005
) by permission
of American Geophysical Union
in
a
in
τ
=
τ
0
, direct flux to the mean flow
τ
−
τ
=
T
r
, and the flux from the waves to
dis
which goes into wave growth (or wave decay for that matter, if the wave-breaking stress is
greater than the input stress, see
(9.27)
below).
More details of the wave influence are shown below the surface. Here, the wave-breaking
sublayer is highlighted where the momentum fluxes are dominated by the direct wave-
breaking action. Its vertical scale is of the order of significant wave height
H
s
. Other
vertical scales indicated are the characteristic depth of penetration of Stokes drift and
MLD. Near the bottom at depth
h
, two other vertical scales can be mentioned which
correspond to the wave bottom-boundary layer
dis
in
the mean flow
τ
=
τ
c
. Net stress to the waves is also demonstrated as
τ
w
=
τ
−
τ
δ
1
(provided that the ocean is shallow
enough to still experience the wave action at the bottom) and to the thicker current-bottom
boundary layer
δ
2
. Vertical solid lines demonstrate profiles of eddy viscosity
K
Z
and drift
velocity
U
.
Search WWH ::

Custom Search