Geoscience Reference
In-Depth Information
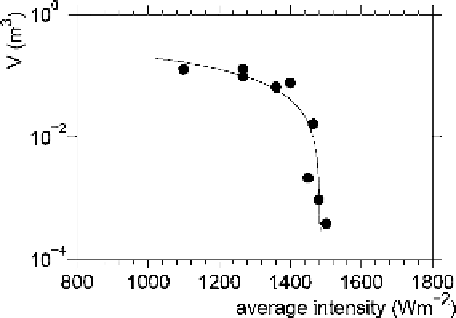
Figure 9.6 Sea-spray volume versus average intensity. Dots signify the experimental data, solid line
is the polynomial fit
(9.5)
suspension above the water surface is demonstrated. With only a small scatter, the relation-
ship between the spray and the laser intensity is clearly evident and can be conveniently
described by a quadratic polynomial:
10
−
7
x
2
=−
.
×
+
.
y
1
68
0
37
(9.5)
where
x
represents the average laser intensity and
y
is the sea-spray volume.
Thus, laser-pulse attenuation can serve a rather robust proxy for the total amount of spray
in the air in the path of the pulse propagation. Since the laser altimeters can be operated
during tropical storms as autonomous stationary deployments, the calibration
(9.5)
can
provide observations of the sea-spray concentration in yet unexplored open-ocean extreme-
wind conditions.
In the meantime, modelling efforts have to rely on analytical models of spray production
and spray-filled WBL. As mentioned above, the dynamic impact of spume can be roughly
divided into two parts: the momentum-damping effect and the turbulence-damping effect.
The momentum-balance effect of spray is most apparent, and we start this section from
quoting its illustration: when water droplets enter the air flow they accelerate and, corre-
spondingly, slow the flow down. To accommodate this effect in their model,
Andreas &
Emanuel
(
2001
) split the total stress into two parts: the turbulent part
(3.7)
which they call
'interfacial surface stress' and spray contribution
τ
sp
. With respect to the latter,
Andreas
(
2004
) later argued that a misconception occurred in
Andreas & Emanuel
(
2001
) where the
two stresses were just added up:
“Because the spray system is closed, however,
this assumption violates the conservation of
momentum.”
Still, as in
Andreas & Emanuel
(
2001
), it was argued that
u
4
τ
sp
∼
∗
.
(9.6)
Search WWH ::

Custom Search