Geoscience Reference
In-Depth Information
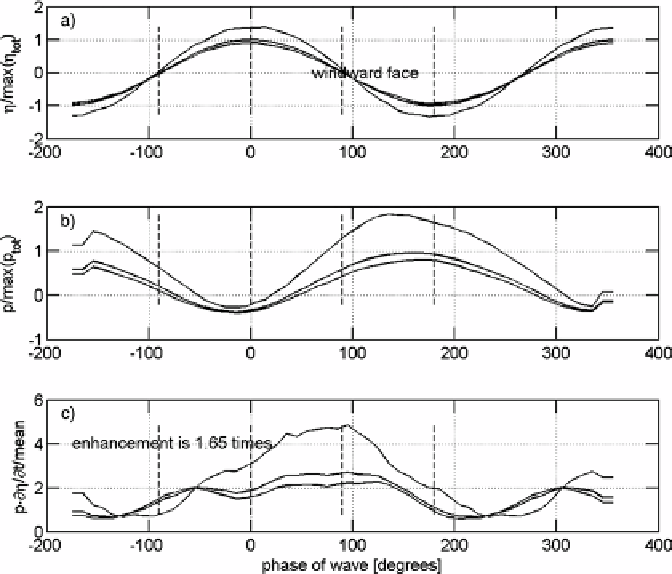
Figure 8.7 Phase-averaged breaking enhancement of the wind input for all the records of
Table 8.1
(6347 waves of which 1132 were breaking). Each plot shows the distribution for all waves (middle
line), for the breakers (upper line) and for non-breaking waves (lower line). a) Mean phase-resolved
wave profile, b) surface-pressure distribution, c) energy-flux distribution - all obtained for the 36
phases resolved. Figure is reproduced from
Babanin
et al.
(
2007b
)
©
American Meteorological
Society. Reprinted with permission
strongly asymmetric and hence are smoothed the most by the bandpass filtering.
Therefore, after determining the phases, the original wave records were used rather than
the bandpass-filtered signals.
Once the time series of phases of individual dominant waves had been obtained, the
same zero-crossing methodology as above was applied to single out the individual waves.
For each wave, the instantaneous phases over the wave profile were placed into one of 36
groups, covering the entire 360
◦
, and the instantaneous flux, wave elevation and pressure
were registered for each phase group. Analysing all individual waves, the distribution of the
average energy flux, the average wave profile and the average air pressure were obtained
for the 36 phases.
The top panel of
Figure 8.7
shows the mean phase-resolved wave profile for the 36
phases resolved. As expected, the average breaking wave is significantly higher and steeper
than the average wave whereas the average non-breaking wave is marginally lower. It is
Search WWH ::

Custom Search