Geoscience Reference
In-Depth Information
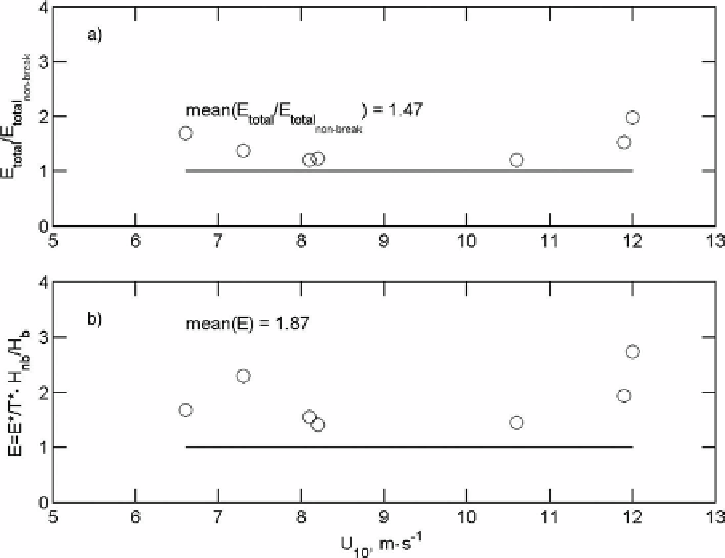
Figure 8.5 Measures of breaking enhancement due to the wave-coherent energy flux from the wind.
a) Ratio of the total energy flux from the wind to the waves, to this flux in the absence of breaking,
as a function of
U
10
. b) Corresponding results for the breaking enhancement to the wind input
E
.
E
=
1, shown with solid line, means no enhancement. Figure is reproduced from
Babanin
et al.
(
2007b
)
©
American Meteorological Society. Reprinted with permission
Figures 8.5
through
8.7
of this section demonstrate different analyses of the flux-
enhancement effect. In
Figure 8.5
, the average enhancement for the eight records of
Table 8.1
is shown.
In the first panel, the ratio of the total energy flux from the wind to the waves
T
non
−
br
,
to this flux in the absence of breaking, is plotted as a function of the wind speed
U
10
.To
determine this ratio, the non-breaking part of the record was effectively 'stretched' to the
whole length of the record:
T
tot
T
non
−
br
E
total
non
−
br
=
E
non
−
br
(8.24)
where
T
non
−
br
is the total duration of non-breaking segments and
E
non
−
br
is the total meas-
ured energy flux during the
T
non
−
br
period. Values of the ratio for individual records vary
from 1.2 to 2.0, with no dependence on the wind speed. Obviously, this ratio will depend
on the wave-breaking rates which are a complex function of the wave spectrum and wind
speed (e.g.
Babanin & Young
,
2005
;
Manasseh
et al.
,
2006
;
Babanin
,
2009
). Therefore, the
Search WWH ::

Custom Search