Geoscience Reference
In-Depth Information
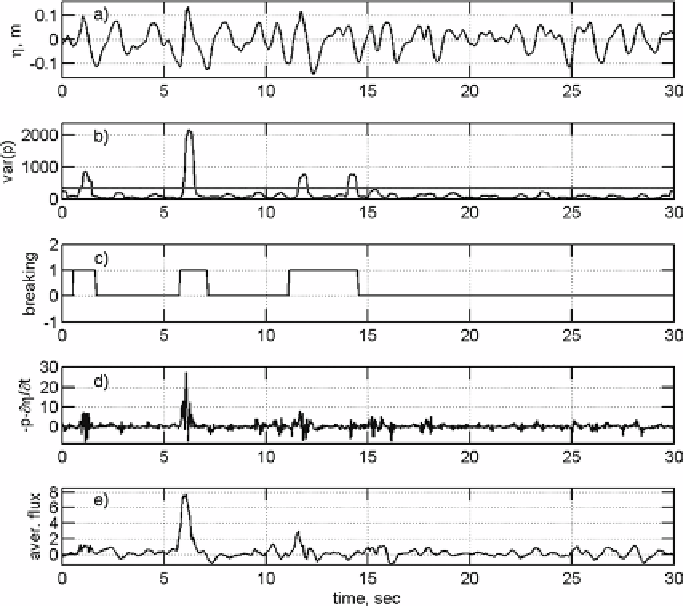
Figure 8.3 Data illustrate the breaking enhancement. a) Typical signal of the surface elevation
η
,
measured by the wave resistance wire. b) Running average of the instantaneous pressure variance
var
(
p
)
(high-pass-filtered pressure squared), based on an averaging interval of 0
.
25
/
f
p
.Break-
ing threshold, taken as a factor
b
t
=
.
2
5 times the run-averaged bottom-pressure-squared signal
(
(
p
))
mean
is shown as the straight line. c) Unit-step-function breaking indicator - from trough to
trough of the wave in the panel a). 0 and 1 correspond, respectively, to 'no breaking' and 'breaking'.
d) Instantaneous energy flux
p
∂
∂
t
. e) Running average of the energy flux, based on the averaging
interval of 0
.
25
/
f
p
. Figure is reproduced from
Babanin
et al.
(
2007b
) © American Meteorological
Society. Reprinted with permission
var
the ability of the bottom pressure probes to detect these same events. In this panel, the
running average of the instantaneous pressure variance var
is plotted. This is the square
of the high-pass-filtered pressure signal. The averaging interval employed to smooth the
instantaneous property was chosen as 0
(
p
)
f
p
. The bursts in the bottom-transducer high-
frequency pressure at appropriate moments are clearly evident, but require setting a rele-
vant threshold to distinguish them above the background pressure/acoustic-noise in order
to analyse the breakers routinely. This breaking threshold, taken as a factor
b
t
times the run-
averaged bottom-pressure-squared signal mean
.
25
/
is employed in the middle subplot,
Figure 8.3
c. This panel is a unit-step-function breaking indicator - from trough to trough
of the wave in the top panel, where 0 indicates no breaking and 1 indicates breaking.
(
var
(
p
))
Search WWH ::

Custom Search