Geoscience Reference
In-Depth Information
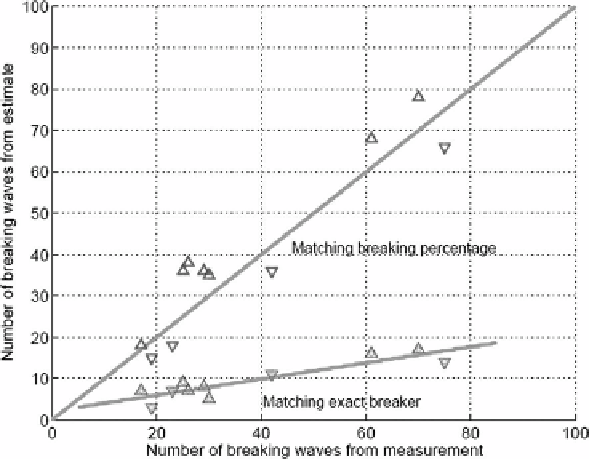
Figure 2.4 Comparison of breaking detection quantities obtained by means of the wavelet analysis
(vertical scale) and observations of whitecaps (horizontal scale). The total breaking counts (by either
of the methods) are designated with open triangles and counts of perfect matchings are designated
by triangles with a circle inscribed inside. The Lake George finite-depth cases are shown by triangles
with vertex points up, and the Black Sea deep-water cases are shown with triangular vertex points
down. The two lines are the one-to-one correlation line (upper line) and the best linear fit to the exact
match data points (lower line). The figure is reproduced from
Liu & Babanin
(
2004
) (copyright of
Copernicus Publications on behalf of the European Geosciences Union)
The straight line through the triangles with circles is the best linear fit to the data. The
data points are the number of perfect matchings we can really amass. In terms of percent-
ages, the results range from a low of 16.7% to a high of 41.2% with an average of 28.4%
of perfect matching cases. This outcome reveals the relative duration of the developing
breaking phase where both analytical and observational methods are expected to detect the
same events.
The slope of the lower line is nearly
3
of the total-count curve. The total count in fact
only includes two phases (i.e. incipient breaking plus developing breaking in the case
of the wavelet method and developing breaking plus subsiding breaking in the case of
whitecapping observations). This means that the second breaking stage lasts for approxi-
mately half the time compared to either incipient or subsiding phases. Thus, the developing
phase is the shortest (fastest) stage and only accounts for some 20% of the wave breaking
duration (and even less if the residual stage is included). Note that our present interpre-
tation of
Figure 2.4
is somewhat different to the conclusions reached by
Liu & Babanin
(
2004
).
Search WWH ::

Custom Search