Geoscience Reference
In-Depth Information
x 10
−7
4
3
2
1
0
0
0.002
0.004
0.006
0.008
0.01
0.012
0.014
s
x 10
−7
4
3
2
1
0
0
2
4
6
8
10
12
14
16
18
Re
wave
x 10
5
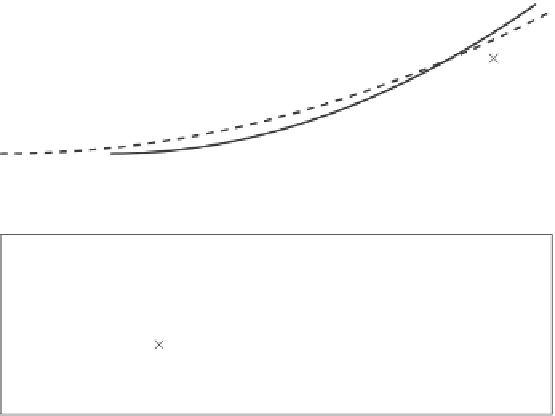
Figure 7.25 Swell decay rate
α
(7.60)
versus (top) steepness
s
=
H
/λ
. Solid line is expression
(7.80)
, dashed line is expression
(7.81)
; (bottom) Wave Reynolds number Re
wave
(7.70)
. Solid line
is expression
(7.82)
as shown with the dashed line in
Figure 7.25
(top). In fact, the dashed line is visually
preferable.
Absence of a clear threshold in terms of steepness is not that unexpected, and the depen-
dence of
dis
on steepness
a
0
(7.76)
also goes through the origin. If the transition is due
to the wave-orbital motion becoming turbulent, then it should have a threshold in terms of
WRN, which does not convert into a steepness unambiguously. In this regard, steepness
(7.78)
is not in contradiction with the observational data of
Figure 7.25
(top).
Figure 7.25
(bottom) demonstrates the dependence of
versus Re
wave
. The best corre-
lation corresponds to the linear fit. The threshold Re
wave
critical
α
3000 is not apparent in
the plot, due to overall values of WRN being high, but it is there and it is imposed in the
dependence
=
10
−
13
α
=
1
.
77
·
(
Re
wave
−
3000
)
(7.82)
shown with the solid line. All the data points correspond to Re
wave
Re
wave
critical
, and
therefore the mechanism of turbulence production by the waves should be active.
In order to estimate the rate of turbulence production by long ocean swells of
Ardhuin
et al.
(
2009a
), the laboratory short-wave dependence
(7.76)
, i.e.
>
a
0
should be
converted into dimensionless form first. Here,
b
has dimensions of m
−
1
s
−
3
, and therefore,
dis
=
b
·


Search WWH ::

Custom Search