Geoscience Reference
In-Depth Information
10
0
10
−5
10
−1
10
0
10
1
0.05
0.04
0.03
0.02
0.01
0
10
−1
10
0
10
1
f, Hz
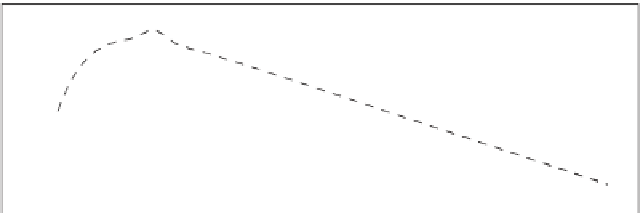
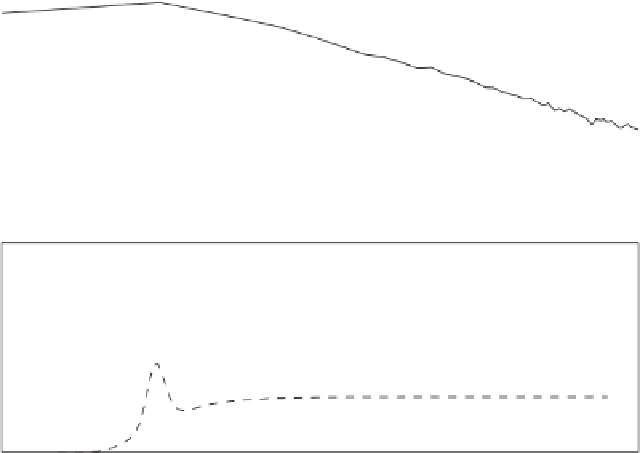
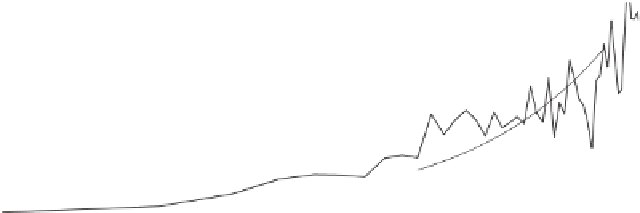
Figure 7.6 Comparison of JONSWAP spectrum
(2.7)
, dashed line, with the helicopter-forced waves,
solid line. (top) The spectra; (bottom) spectrum-tail level
α
. Curved line indicates
f
−
4
trend
In
Figure 7.6
, outcomes of an artificial field test for an extreme wind forcing are shown.
The waves were measured by the wave array as described in
Babanin & Soloviev
(
1998a
,
b
),
and a helicopter pilot was asked to hover his machine over the array in order to observe
what difference to the background conditions that would make.
The background conditions were represented by a light wind of
U
10
≈
6m
/
s with the
wind-wave spectrum of
f
p
≈
0
.
3 Hz. The JONSWAP spectrum
(2.7)
with such a peak
10
−
3
, corresponding to the upper limit of the
parameterisation
(5.75)
for comparison, is shown by a dashed line.
The Russian helicopter MI-8 weighs 11 T, and with a blade diameter of 25m it was
estimated that the enforced surface horizontal winds were of the order of
U
surface
∼
frequency and tail-level
α
Phillips
=
13
.
2
·
s.
Hurricane-like conditions, therefore, were created locally in the vicinity of the wave array.
Visually, every wave was breaking.
The measured spectrum of the background waves with such additional localised forcing
is plotted in
Figure 7.6
with the solid line. The top panel shows the spectra themselves, and
the lower panel - the level
30m
/
1Hz
were unimodal, i.e. still carried information on the wind which generated them initially,
and at higher frequencies they were observed to be isotropic, that is, disconnected from the
wind and fully driven by the helicopter.
α
of these spectra. Directional spectra at frequencies
f
<


Search WWH ::

Custom Search