Geoscience Reference
In-Depth Information
0.4
0.35
0.3
0.25
0.2
0.15
0.1
0.05
0
1
1.5
2
2.5 3
Modulation depth R
3.5
4
4.5
5
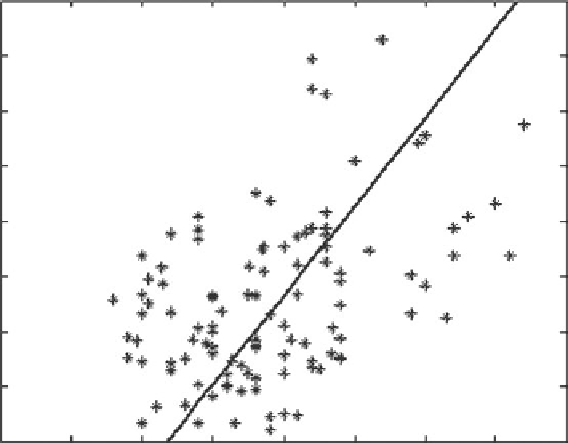
Figure 6.4 Severity coefficient
s
g
(2.32)
, denoted as
S
in the figure, as a function of modulation
depth
R
(5.3)
. Solid line is parameterisation
(6.1)
. Figure is reproduced from
Galchenko
et al.
(
2010
)
© American Meteorological Society. Reprinted with permission
energy loss grows with the modulation depth. The figure includes 109 points, and the linear
correlation coefficient between
R
and
S
is
K
44
+
0
.
13
−
17
(for a 95% confidence interval).
Energy loss varies very significantly, from 2% to 35%. Note that this is energy lost from a
group consisting of several waves, that is, the severity in terms of the energy of individual
breaking waves is much greater (see
Section 2.7
). A linear function in
Figure 6.4
is
=
0
.
0
.
S
=
(
0
.
16
±
0
.
03
)
R
−
(
0
.
35
±
0
.
06
).
(6.1)
where 95% confidence limits are shown.
The observed linear trend gives credit to the suggestion made above that it is the hydro-
dynamics that primarily drives the breaking severity in the case of instability-caused break-
ing, and the depth of modulation is its indicator. The large scatter, however, points out that
such a straightforward picture may be oversimplified. Different depths of the modulation
signify different degrees of development for the modulation at the stage of the wave break-
ing, but it appears that this degree is not the only property to affect the severity even in the
absence of the wind.
The role of the wind is also not simple and not limited to variation of this degree only.
Stronger winds do reduce modulation depth. This was observed experimentally in self-
modulated wave trains by
Babanin
et al.
(
2010a
), and it was confirmed numerically by
Galchenko
et al.
(
2010
). In
Figure 6.5
, modulation depth
R
immediately before breaking is
Search WWH ::

Custom Search