Geoscience Reference
In-Depth Information
10
−4
a)
10
−6
10
−8
10
−10
10
−1
10
0
10
1
10
2
f, Hz
6
b)
4
2
0
10
−1
10
0
10
1
10
2
f, Hz
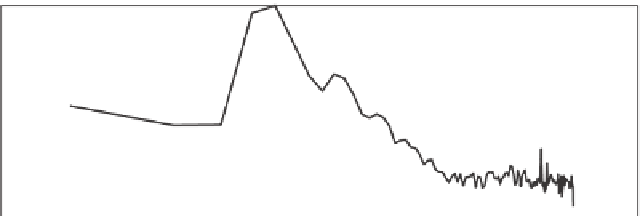
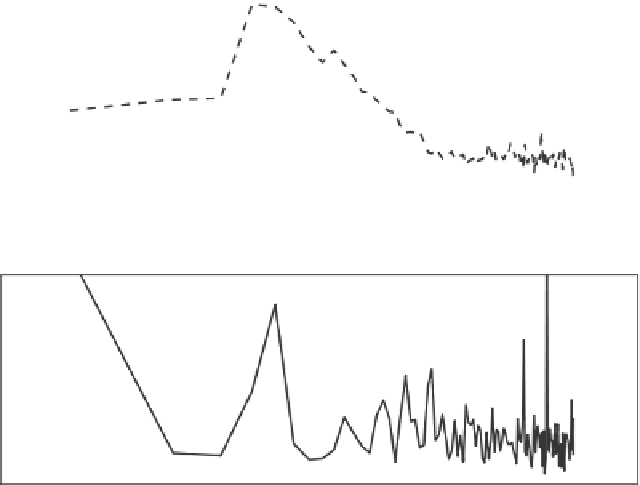
Figure 6.1 a) Spectra
P
of the time series of IMF
=
1
.
8Hz, IMS
=
0
.
30
,
U
/
c
=
0. Solid line
corresponds to the pre-breaking spectrum measured at the second probe (see solid-line time series in
Figure 6.2
). Dashed line is post-breaking spectrum measured at the third probe (dashed time series in
Figure 6.2
). Multiples of IMF are shown with dashed vertical lines. Multiples of the incipient-breaker
2 Hz frequency are shown with solid vertical lines. b) Ratio of the pre-breaking and post-breaking
spectra. Solid horizontal line signifies ratio of 1, vertical lines have the same meaning as in the top
panel. Figure is reproduced from
Babanin
et al.
(
2010a
) by permission
to be exact, depending on the phase of individual waves with respect to the envelope (see
also
Section 2.7
for corresponding discussion of this figure).
With that in mind, we still see that the two waves that broke practically disappeared, as
well as the entire modulation. The only waves that can still be tracked are the second and
the third ones after the incipient breaker at probe 2. An overall severity of 45%, integrated
over the spectrum above, is quite significant.
The number of waves in the segment has also changed. Between the three incipient
breakers at probe 2, one can count 17 waves, and at probe 3 this number is closer to 16, i.e.
frequency downshifting has occurred (see also
Melville
,
1982
;
Su
et al.
,
1982
;
Bonmarin
,
1989
;
Reid
,
1992
;
Tulin & Waseda
,
1999
;
Babanin
et al.
,
2010a
,
2011a
). This is how
Bonmarin
(
1989
) describes the downshifting as a result of plunging breaking:
“the potential energy of the original breaking wave finally becomes wholly dissipated in the midst of
the successive splash cycles” to a point “as if a wave crest had never existed at this location”.


Search WWH ::

Custom Search