Geoscience Reference
In-Depth Information
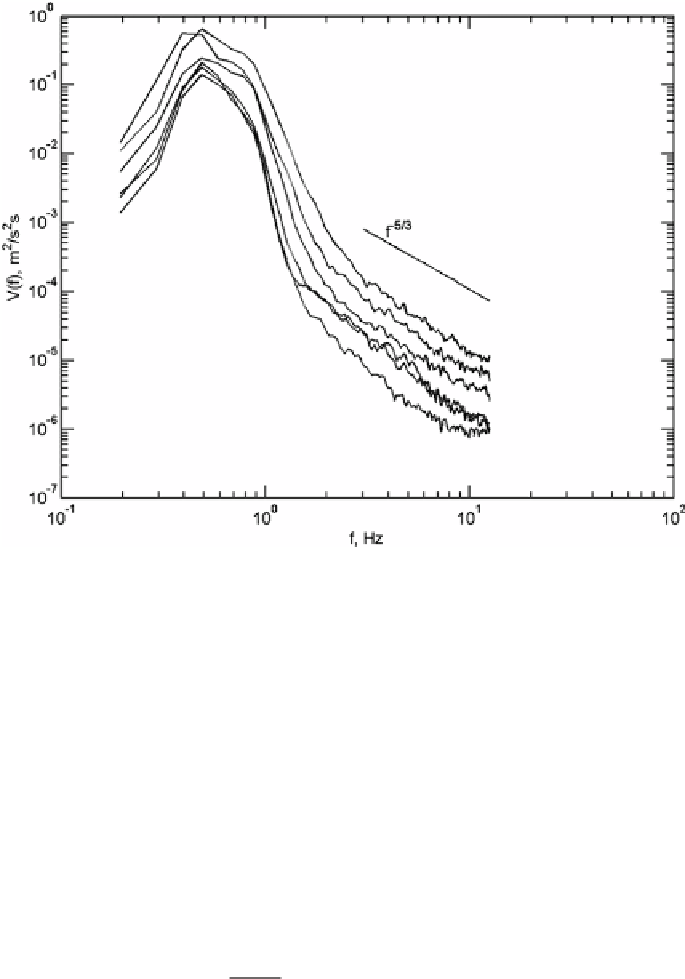
Figure 5.36 Velocity spectrum
V
(
f
)
measured at 10 cm
,
20 cm
,
30 cm
,
40 cm
,
50 cm and 60 cm dis-
tances from the surface for a 9
.
7m
/
s mean wind speed (the more energetic spectra are closer to the
surface). The Kolmogorov interval slope of
f
−
5
/
3
is shown with a straight line. Figure is reproduced
from
Young & Babanin
(
2006a
)
©
American Meteorological Society. Reprinted with permission
10 cm increments and the six 20min-averaged spectra shown in
Figure 5.36
were recorded
at 10 cm
50 cm and 60 cm from the mean water level, respectively.
The wind was steady in speed and direction over the two-hour time period of measuring
the profile,
U
10
,
20 cm
,
30 cm
,
40 cm
,
=
9
.
7m
/
s on average, with a maximum of 10
.
9m
/
s and a minimum of
8
s. The more energetic spectra shown in
Figure 5.36
were recorded closer to the
surface, with the energy level decaying with depth.
Dissipation rates
.
3m
/
dis
obtained on the basis of such spectra using
(5.66)
are shown in
Figure 5.37
. This figure plots
dis
as a function of
z
in dimensionless form
function
gz
u
2
∗
w
dis
κ
z
=
(5.71)
u
3
∗
w
where
u
4 is the von Karman constant, and the
mean water level is now treated as the wall. Wall-law scaling is applied to the dissipation
dis
and height-of-fully-developed-waves scaling is applied to the distance to the surface
z
(see
Agrawal
et al.
,
1992
;
Melville
,
1994
). For boundary layers over solid walls, such
scaling of the dissipation would give values of
is the friction velocity in the water,
κ
≈
0
.
∗
w
Search WWH ::

Custom Search