Geoscience Reference
In-Depth Information
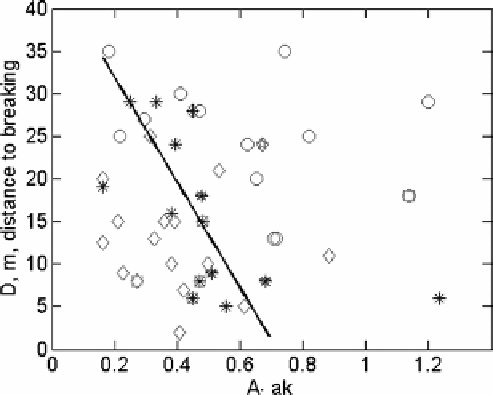
Figure 5.34 Distance to breaking
D
versus
M
Id
=
A
·
ak
. Solid line is dependence
(5.64)
. Sym-
bolsasin
Figure 5.33
, for seeded modulation with
M
I
=
1. Additionally, squares signify
M
I
=
2,
pentagrams
M
I
=
0
.
5. Figure is reproduced from
Babanin
et al.
(
2011a
)
Babanin
et al.
(
2011a
) found that the limit for existence of the modulational instability in
terms of
M
Id
(5.62)
is
A
·
ak
≈
0
.
18
(5.63)
which is again absolutely feasible. With
A
∼
1, there should be
ak
∼
0
.
2 which is possible
in the field, and for
A
∼
1
.
8, there should be
ak
∼
0
.
11 which is a typical steepness of
ocean waves.
Babanin
et al.
(
2011a
) further provided parametricmeans to separate directional-focusing
breaking from modulational-instability breaking.
Figure 5.34
verifies the dependence of
distance to breaking
D
on
A
ak
. In the figure, the instability breaking (circles) and
linear-superposition breaking (diamonds) appear reasonably split. It is interesting that the
dividing line, even visually, goes through the asterisks that were independently identified
as transitional cases. The separation line was parameterised as the fit to asterisk data points:
·
D
=−
62
A
·
ak
+
68
.
(5.64)
In this figure the same symbols as in
Figure 5.33
are used. In
Babanin
et al.
(
2011a
), the
modulation was seeded, typically with the modulational index
M
I
=
1. For comparison, a
few cases of
M
I
5 (pentagrams) were also considered. These
cases do not exhibit any essential trend, being basically in the middle of the data cloud.
Marginally, perhaps, higher
M
I
cases (longer groups) lead to transitional points being
under the curve (i.e. in the focusing-breaking area), and
M
I
=
=
2 (squares) and
M
I
=
0
.
5 to the transitional points
being in the modulational-breaking area - but this needs further statistically significant
verification.
0
.

Search WWH ::

Custom Search