Geoscience Reference
In-Depth Information
0.5
0.4
0.3
a
1
0.2
0.1
b
2
b
1
0
a
2
−0.1
−0.2
−0.3
−0.4
−0.5
0
1
2
3
4
5
6
horizontal distance, x
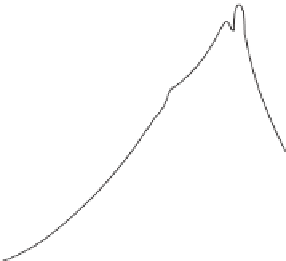
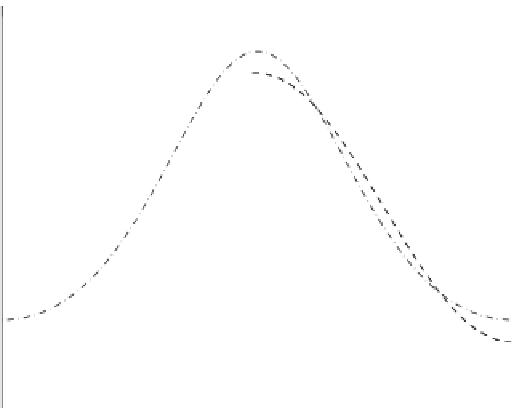
Figure 1.2 Geometric definition of wave skewness and asymmetry. The wave propagates from
left to right.
b
1
and
b
2
are horizontal distances from the breaker crests to the zero-upcrossing
and -downcrossing respectively.
a
1
and
a
2
are the breaker crest height and trough depth respec-
tively. Solid line - numerically simulated incipient breaker (skewness is
S
k
=
.
1
15, asymmetry is
A
s
=−
.
51). Dashed line - harmonic wave of the same wavelength and wave height (
S
k
=
A
s
=
0).
Dash-dotted line - nonlinear wave of the same length and height obtained by means of perturbation
theory (
S
k
=
0
0). Dotted lines - mean (zero) water level (horizontal) and line drawn from
the breaker crest down to the level of its trough (vertical). Figure is reproduced from
Babanin
et al.
(
2010a
) with permission
0
.
39,
A
s
=
An incipient breaker shown in
Figure 1.2
(solid line) is produced numerically by means
of the Chalikov-Sheinin model (hereinafter CS model (
Chalikov & Sheinin
,
1998
;
Cha-
likov & Sheinin
,
2005
)) which can simulate propagation of two-dimensional waves by
means of solving nonlinear equations of hydrodynamics explicitly. The shape of such
a wave is very asymmetric, with respect to both vertical and horizontal axes, and even
visually the wave looks unstable.
Instability is a key word in the breaking process. The wave that we interpret as the
incipient breaker in
Figure 1.2
cannot keep propagating as it is: it will either relax back
to a less steep, skewed and asymmetric shape, or collapse. We will define the steepness,
skewness and asymmetry (with respect to the vertical axis) as
H
λ
,
=
ak
=
π
(1.1)
a
1
a
2
−
S
k
=
1
,
(1.2)
b
1
b
2
−
A
s
=
1
,
(1.3)


Search WWH ::

Custom Search