Geoscience Reference
In-Depth Information
50
40
30
20
10
0
0
0.05
0.1
0.15
0.2
0.25
0.3
0.35
0.4
0.45
0.5
IMS
50
40
30
20
10
0
0.05
0.1
0.15
0.2
ε
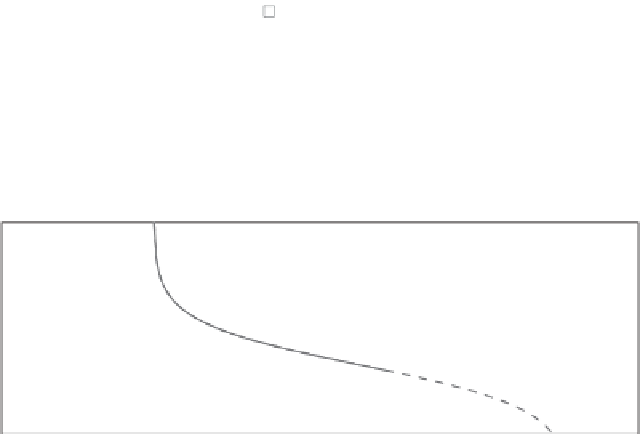
Figure 5.17 Parameterisation of the breaking probability. (top panel) Laboratory data. Number of
wavelengths
N
to breaking versus IMS. No wind forcing: o - IMF
=
1
.
6Hz; x-IMF
=
1
.
8Hz;
+-IMF
=
2
.
0 Hz. Filled circles represent IMF
=
2
.
0 Hz, with wind forcing applied. Squares
are data points derived from
Melville
(
1982
). The parameterisation
(5.10)
is shown with a solid line.
(bottom panel) Field data. Inverse breaking probability
b
T
, measured by visually detected whitecaps,
versus the peak spectral steepness
0. The line identifies the
approximation
(5.27)
(the dotted part is the extrapolation based on parameterisation of
Babanin
et al.
(
2001
)). Figure is reproduced from
Babanin
et al.
(
2007a
) by permission of American Geophysical
Union
peak
. Triangles signify measured
b
T
=
model - see discussion of modelling limitations at the beginning of
Section 5.1
) and if
<
0
.
08 the wave, in the absence of wind forcing, will never break (compared to
=
0
.
1
for the model).
In
Figure 5.17
(top) two points (squares) are shown which were derived from Figs. 1
and 2 of
Melville
(
1982
) for comparison. The two measurements in
Melville
(
1982
)were
conducted for initially uniform wave trains, their initial steepness and approximate dimen-
sionless distance to breaking being known. Although recorded under different conditions,
for much longer waves in a different wave flume, these points agree very well with the
above parameterisation and provide strong support for laboratory results presented here.
The relationship
(5.10)
potentially provides a means of predicting the onset of break-
ing in the open ocean, although some further modification is required for application to
such a case. In a field situation, the notion of an initial monochromatic steepness does not


Search WWH ::

Custom Search