Geoscience Reference
In-Depth Information
a)
b)
0.04
0.04
0.02
0.02
0
0
−0.02
−0.02
−0.04
−0.04
0
0.5
1
1.5
2
0
0.5
1
1.5
2
c)
d)
0.04
0.04
0.02
0.02
0
0
−0.02
−0.02
−0.04
−0.04
0
0.5
1
1.5
2
0
0.5
1
1.5
2
time, sec
time, sec
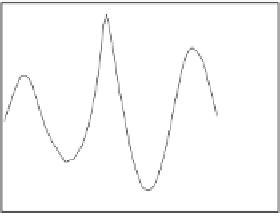
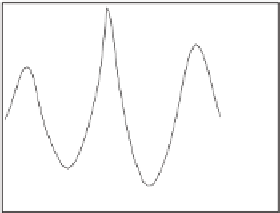
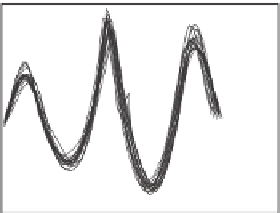
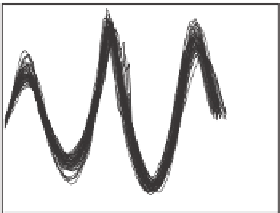
Figure 5.14 As in
Figure 5.5
, with wind forcing. IMF
=
1
.
5Hz
,
IMS
=
0
.
30
,
U
/
c
=
3
.
9. (top left
panel) The steepest incipient breaker. (top right panel) The five steepest incipient breakers. (bottom
left panel) The 20 steepest incipient breakers. (bottom right panel) The 50 steepest incipient breakers
In
Figure 5.15
, analogous to the no-wind
Figure 5.7
, the statistics of a comprehensive
set of properties for the 20 highest incipient breakers and their links to the preceding and
following wave are shown. Quantitatively, for the 20 waves approaching breaking, the wind
influence generally brought more order to their shapes, as the scatter of almost all of the
properties is reduced and the marginal dependences became clearer. Qualitatively, the wind
changed the shape of the preceding wave which is now not skewed negatively on average
(first subplot in the third row) and increased the steepness of the following wave from
=
27 on average (not shown).
With regard to the asymptotic shape of the breaker, the wind in
Figure 5.16
has a scatter-
ing rather than stabilising influence. In this figure, analogous to
Figure 5.10
, characteristics
of the five steepest waves are plotted in the presence of wind. Apparently, at these very last
pre-breaking stages, the wind is capable of modifying the wave, which is about to lose its
stability, and to somewhat randomise its characteristics.
In the first subplot of the top row, the limiting skewness is plotted versus limiting steep-
ness. Skewness no longer approaches 1, but steepness extends beyond the 2
0
.
19 to
=
0
.
=
0
.
88
limit and reaches 2
=
0
.
97 (see also
Toffol i
et al.
,
2010a
). The asymmetry is no longer


Search WWH ::

Custom Search