Geoscience Reference
In-Depth Information
0.04
0.02
0
−0.02
−0.04
0
5
10
15
20
2
5
0.04
0.02
0
−0.02
−0.04
0
5
10
15
20
2
5
0.04
0.02
0
−0.02
−0.04
0
5
10
15
20
2
5
0.04
0.02
0
−0.02
−0.04
0
5
10
15
20
25
time, sec
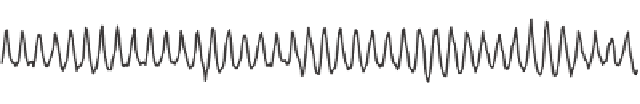
Figure 5.2 Time series of surface elevations
η
measured at the second wave probe, IMF
=
1
.
6Hz.
(top panel) IMS
=
0
.
31
,
U
/
c
=
0. (second top panel) IMS
=
0
.
25
,
U
/
c
=
0. (second bottom panel)
IMS
=
0
.
23,
U
/
c
=
0. (bottom panel) IMS
=
0
.
23
,
U
/
c
=
11
generated wave is not noticeable at this first probe, except for the extreme forcing case,
where wind-generated ripples are visible in the time series.
The wave profiles look very different at the second probe, 10
.
53m from the paddle,
some 10 wavelengths downstream (
Figure 5.2
). In all cases, breaking has still not occurred.
Waves in the top three panels evolve without wind forcing, and in the bottom subplot waves
are shown strongly forced (
U
11).
The top subplot shows initially very steep waves of IMS
/
c
=
31. By the time they reach
probe 2, they have developed into a very strongly modulated group of six waves. Less
initially steep waves (IMS
=
0
.
25, second subplot) evolve into a more elongated modulated
group of some seven waves. Even less steep waves (IMS
=
0
.
23, third subplot) evolved
into a subsequently weaker modulated group of approximately 7.5 waves (15 waves in
two modulations). Note that no initial modulation was introduced (see
Figure 5.1
). This
interesting observation is, however, not unexpected and is in full qualitative agreement with
the discussion above: i.e. if
M
I
for the system does not change, a larger initial steepness
should lead to fewer waves in the modulation which results from the Benjamin-Feir-like
instability.
The effect that the wind forcing has on the modulation is demonstrated in the bottom
subplot of
Figure 5.2
. Here, very strongly wind-forced mechanically generated waves of
=
0
.


Search WWH ::

Custom Search