Geoscience Reference
In-Depth Information
1
0.8
0.6
0.12
0.14
0.16
0.18
0.2
0.22
0.24
0.26
0.28
1
0.8
0.6
0.12
0.14
0.16
0.18
0.2
0.22
0.24
0.26
0.28
0
−0.2
−0.4
0.12
0.14
0.16
0.18
0.2
0.22
0.24
0.26
0.28
IMS
Figure 4.10 Simulations of incipient breaking. (top panel) Steepness 2
(1.1)
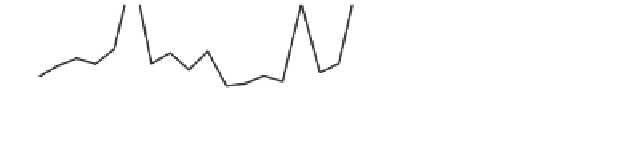
; (middle panel) skew-
ness
S
k
(1.2)
; (bottom panel) asymmetry
A
s
(1.3)
-versusIMSfor
U
/
c
=
3 (dotted line), 5 (dashed
line), 8 (dash-dotted line) and 11 (solid line)
limited number of wave periods (i.e. simulation was stopped after some 400 wave periods
regardless of whether the wave had reached breaking onset or not). Thus, in these numerical
experiments, for different wind-forcing situations waves stop breaking at different IMS
(e.g. for
U
/
c
=
3, the waves do not have enough time to break if IMS
<
0
.
25).
The limiting steepness at breaking onset 2
(1.1)
in the top subplot is plotted versus IMS
for
U
3 (dotted line), 5 (dashed line), 8 (dash-dotted line) and 11 (solid line). The
incipient-breaking steepness grows both for higher IMS and stronger wind forcing. The
latter is particularly counter-intuitive. Even though the growth is marginal, the four lines
clearly separate and therefore instantaneous steepness at breaking appears to be somewhat
larger at stronger winds.
The skewness and asymmetry of the incipient breakers (middle and bottom panels) do
not exhibit a dependence on IMS or wind forcing except at extreme forcing of
U
/
c
=
11.
At such winds, the skewness is somewhat lower (the wind flattens the wave crests) and the
wave is slightly less tilted. Thus, it is only at extreme conditions that the wind is capable
of influencing the wave shape at breaking and even then the effect is only marginal.
The same properties of the incipient breaker are plotted versus
U
/
c
=
/
c
for three different
IMS values of 0.20, 0.24 and 0.28 in
Figure 4.11
.ThevalueofIMS
=
0
.
28 is extreme and


Search WWH ::

Custom Search