Geoscience Reference
In-Depth Information
4.1.2 Simulation of the breaking onset
The potential model is not suitable for investigation of breaking in progress. At this stage,
the wave can hardly be regarded as irrotational (see e.g.
Gemmrich & Farmer
,
2004
;
Gemmrich
,
2010
). Therefore, in the numerical experiments described, the CS model was
only employed to simulate development of the steep waves from some initial (mostly uni-
form) conditions to the breaking onset which signified a wave grown beyond a certain
stability limit. In the numerical simulations, a wave was regarded as breaking if the water
surface became vertical at any point. This was discussed in
Section 2.1
, where the criterion
for terminating the run was also formulated
(2.1)
.
Nevertheless, it is important to consider nonlinear characteristics of the wave at this
final stage of numerical simulations, as they will represent the asymptotic properties of the
incipient breaker.
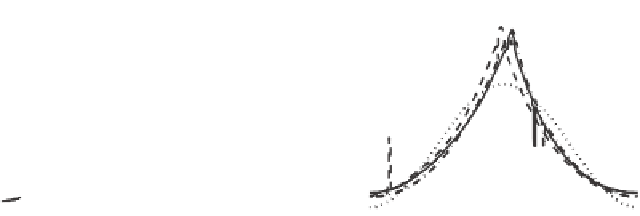
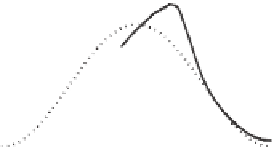
Figure 4.8
shows wave profiles prior to breaking at the point when the
wave of IMS
26 reached its maximum values of negative asymmetry (left panel) and
the maximum of its skewness/steepness (right panel). Note that these points are separated
by three-quarters of the oscillation period (the nonlinear evolution of this wave has been
analysed in
Figure 4.2
of
Section 4.1.1
). As in
Figure 4.2
, cases of
U
=
0
.
/
c
=
2
.
5
,
5
.
0 and
10
0areshown.
The shape of the wave in the left panel corresponds well to the common notion of a
breaker. Its negative skewness of
A
s
=−
.
.
42 (for all the three winds) is high by all stan-
dards (e.g.
Caulliez
,
2002
). As indicated by
Figure 4.2
, however, this is not an incipient
breaker yet. This wave will continue to develop to the shape shown in the right panel, as
also demonstrated in
Figure 4.2
.
In the right panel, what is interpreted within the model as incipient breaking is shown. If
compared with the dashed profile of the initial wave, one can see that the trough is flatter
and the crest is much sharper.
0
0.4
0.4
0.2
0.2
0
0
−0.2
−0.2
0
2
4
6
0
2
4
6
length
length
Figure 4.8 Numerically simulated wave shape prior to breaking. Waves propagate from left to right.
(left) minimal (maximal negative) asymmetry
A
s
(1.3)
; (right) maximal skewness/steepness
S
k
/
(1.2)
/
(1.1)
.IMS
=
0
.
26
,
U
/
c
=
2
.
5 (solid line), 5
.
0 (dashed line), 10
.
0 (dash-dotted line). Initial
wave is shown by dotted line


Search WWH ::

Custom Search