Geoscience Reference
In-Depth Information
0.4
0.2
0
0
2
4
6
8
10
12
14
16
18
20
1
0.5
0
−0.5
0
2
4
6
8
10
12
14
16
18
20
0.5
0
−0.5
0
2
4
6
8
10
12
14
16
18
20
duration (wave periods)
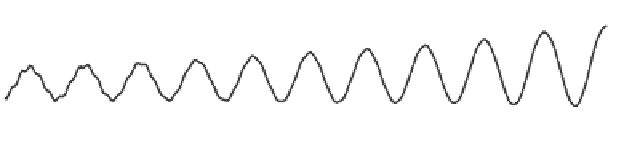
Figure 4.5 Simulations of steepness (first panel), skewness (second panel) and asymmetry (third
panel) of the wave of IMS
=
0
.
13
,
U
/
c
=
10
.
0 as it evolves to breaking
breaking, similar to the previous tests, supports the concept of a limiting breaking-onset
value. Compared with the same wind forcing in
Figure 4.2
, it now takes much longer (19
wave periods versus 3) to achieve this steepness, but as soon as it is reached, the wave
breaks.
It is instructive to observe the behaviour of the skewness and asymmetry of these much
less steep waves (bottom two panels). Since nonlinearity is now obviously weaker, it could
have been expected that the oscillations would start frommuch smaller magnitudes of
S
k
=
0
41
similar to values observed previously. These may be indicative of limiting values of the
wave skewness and asymmetry, but they are obviously not a breaking criterion, as in the
previous test they did not lead to breaking unless the limiting steepness was also reached.
Co-spectra of running skewness and asymmetry of the IMS
.
33 and
A
s
=
0
.
18. They do eventually grow to maxima of
S
k
=
0
.
77 and
A
s
=
0
.
13 wave are shown in
Figure 4.6
. These values are quite similar to those for the case of IMS
=
0
.
26 in
Figure 4.4
above, but it is noticeable that the peak at half the inverse wave period is now narrower and
the coherence is stronger across almost the entire frequency band. Apparently, the stronger
nonlinearity tends to somewhat randomise the wave-shape oscillations in
Figure 4.4
.The
obvious decrease in the coherence between one and two inverse wave periods still requires
an explanation.
=
0
.


Search WWH ::

Custom Search