Geoscience Reference
In-Depth Information
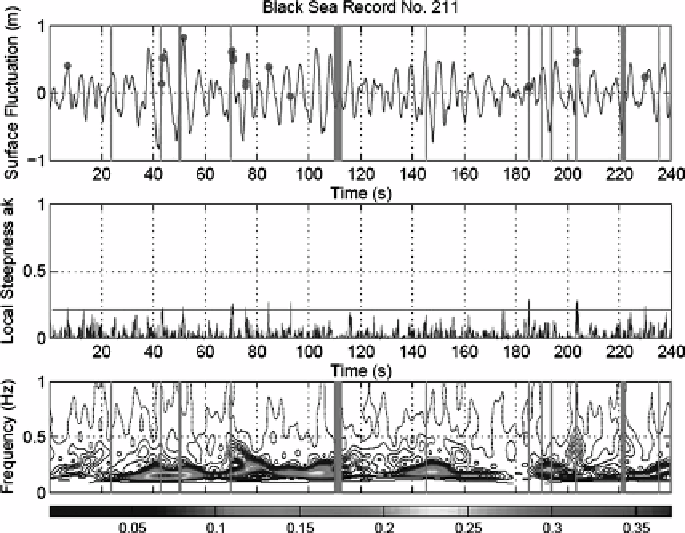
Figure 3.16 (top) Comparing breaking events detected from the wavelet approach in dots, with a
Black Sea measurement (see last four records in
Table 5.1
) in vertical bars. (middle) Local steepness
ak
. The straight line shows
γ
=
0
.
2, the chosen threshold value. (bottom) Instantaneous wave spectra
in relative units (shading scale below). The horizontal axis is the time axis, as in the top two panels.
Figure is reproduced from
Liu & Babanin
(
2004
) (copyright of Copernicus Publications on behalf of
the European Geosciences Union)
incipient breakers will be detected by the wavelet method and will not be detected by
the measurements, and the subsiding breakers, on the other hand, will be detected by the
measurements whereas the wavelet method will fail to pick them up. The relative duration
of the different breaking phases was discussed in
Section 2.4
.
As one might have expected in general, there are breaking cases that the wavelet approach
captured, there are breaking cases that the wavelet approach did not capture, and there are
cases when the approach anticipated breaking but it was not confirmed by the observed
whitecaps. These are all attributes of wave-breaking phases. Therefore, for individual break-
ings, a perfect match between the measurement and the detection from the wavelet proce-
dure cannot be expected. Matching of total breaking percentages was used. The results
of
λ
L
s based on applying the matching-breaking per-
centage approach to the Black Sea and Lake George data are given in
Tables 3.2
and
3.3
,
respectively.
Another interesting insight provided by the wavelet method pertains to the relation
between wave breaking and wave grouping.
Donelan
et al.
(
1972
), followed by a number
γ
value assessments for different
Search WWH ::

Custom Search