Geoscience Reference
In-Depth Information
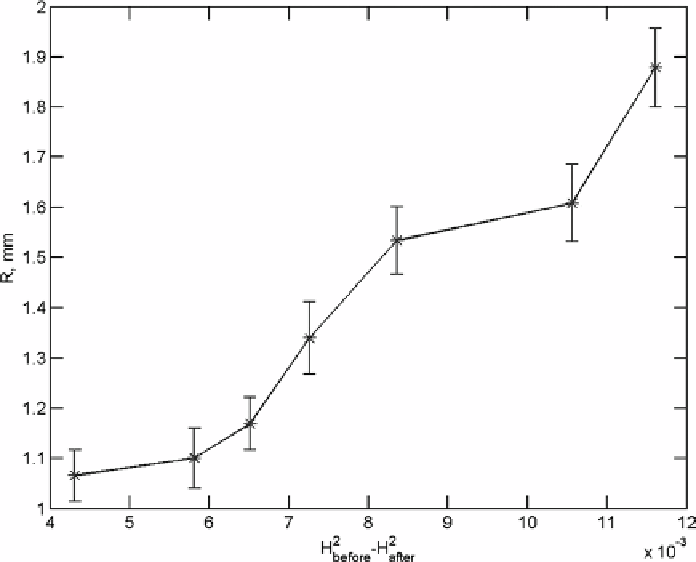
Figure 3.12 Breaking severity assumed as bubble radius
R
0
versus laboratory energy loss
(2.24)
.
Vertical bars are for 95% confidence limit on
R
0
(denoted as
R
in the figure). Figure is reproduced
from
Manasseh
et al.
(
2006
) © American Meteorological Society. Reprinted with permission
(5) Each detected bubble is linked to the synchronous wave-height record by means of a zero-
crossing or RWR analysis, thus determining the period of wave breaking at the time of bubble
detection and the wave-period distribution of the breaking rate (this procedure is detailed in
Section 5.3
dedicated to breaking-probability analysis);
(6) From the laboratory experiments, the mean bubble size can be related to wave breaking severity;
(7) The rate of occurrence of breaking events times their severity can be used to estimate wave
energy dissipation due to breaking (
Sections 2.7
,
6.2
);
(8) The wave-period distribution of the dissipation rate is obtained (see
Section 6.2
).
At the time of writing, the instrumentation and equipment tested by
Manasseh
et al.
(
2006
) only exists as a laboratory version, and its field and any industrial applications are
yet to be developed. Potentially, however, the technique is very promising in this regard.
Being a passive technique, it does not involve large levels of power supply and can be oper-
ated on batteries. If collocated with surface-wave measurements and intended to measure
wave-breaking occurrence and severity, the device only has to record the size of bubbles
and the time when they are generated. Such a sequence of double numbers, particularly
given the fact that wave breaking is a relatively rare event, requires a minimal amount
of electronic memory for data storage. Therefore, a field version of the device is quite
Search WWH ::

Custom Search