Geoscience Reference
In-Depth Information
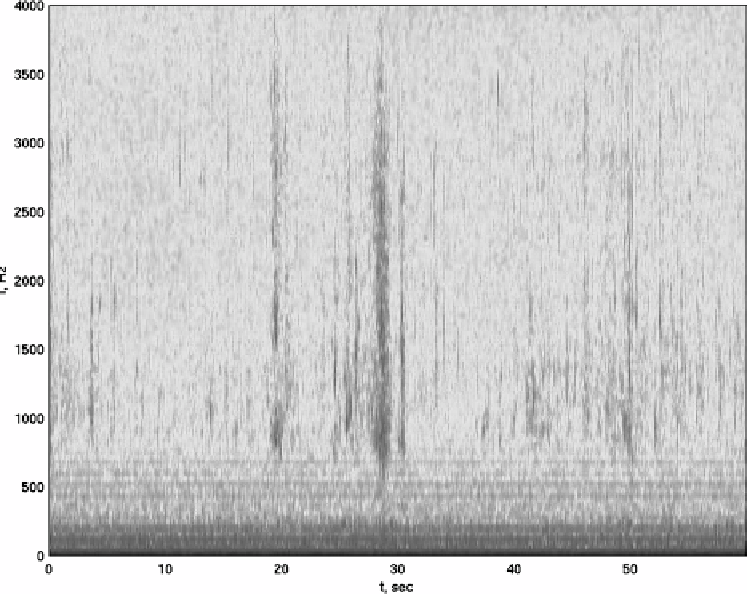
Figure 3.8 Spectrogram of one-minute record of acoustic noise recorded by a bottom-mounted
hydrophone during wave record 12 of
Table 5.2
. Figure is reproduced from
Babanin
et al.
(
2001
)
by permission of American Geophysical Union
amount of energy lost etc., particularly in circumstances when the background ambient
noise is weak as in the laboratory (
Melville
et al.
,
1992
).
The Lake George wave and breaking data were further used to develop another passive
acoustic method, capable of detecting both dominant and small breaking events, as well as
their severity (
Manasseh
et al.
,
2006
). As described above, individual sound pulses corre-
sponding to the many individual bubble-formations during wave breaking events typically
last only a few tens of milliseconds. For details on signal conditioning, pulse process-
ing, determination of optimal trigger level and other elements of the analysis, we refer the
reader to the original paper. Here, we will mention that with the new technique, each time a
sound-level threshold was exceeded, the acoustic signal was captured over a brief window
typical of a bubble-formation pulse, registering one count. Each pulse was also analysed to
determine the likely bubble size generating the pulse.
Using the time series of counts and visual observations of the video record, the sound-
level threshold that detected bubble-formations at a rate optimally discriminating between
breaking and non-breaking waves was determined by a classification-accuracy analysis.
Search WWH ::

Custom Search