Geoscience Reference
In-Depth Information
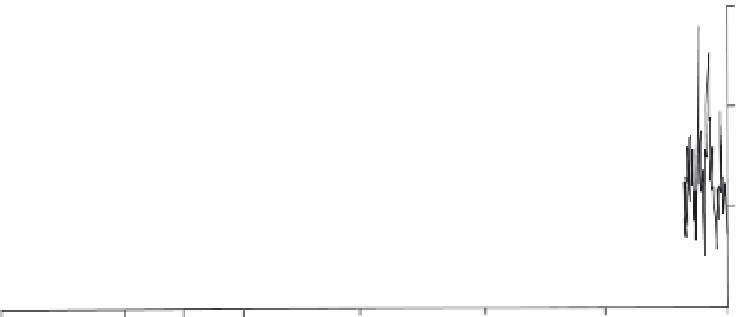
60
W1
W2
W6
W7
40
D1
D6
W3
W5
W4
D5
D7
D4
D3
D2
20
0
1080
1455
1900
Cal AD
1200
1000
800
600
400
200
0
Number of layers (counted from top)
Figure 2.13.
Annual record of rainfall and drought, Shihua cave, Beijing, China
from a speleothem over the past 1100 years (from Liu
et al
., 1997). D
=
drought and
W
=
wet.
consists of a light coloured zone at the base of the band, which is likely to have
been deposited by old water, and a dark part at the top of the band deposited by
fresh water. They developed a time series comparing individual layer thickness
with an historical index of drought and flood (Fig. 2.13)andtheinstrumented
record of precipitation from AD 1951 to 1980. Both records agreed on the years
of high rainfall providing confidence in the interpretation of the older part of
thestalagmite banding record. The thickness of individual layers was taken as a
proxy for the level of annual precipitation. They found several peaks in annual
rainfall and years of drought over the past 1100 years. Seven episodes of drought
were identified and spectral analyses highlighted several climatic cycles with
periodicities of 136, 50, 16--18, 11 and 5.8 years. There was also evidence for
possible millennial scale variability.
Conclusion
Palaeodrought records provide one of the more accurate and informa-
tive archives of the long-term nature of an extreme natural event. Annual layers
in tree rings, speleothems and lake sediments show that droughts, both in terms
of their severity and duration, can be highly variable over time. One of the clear
messages from these records is that 20th Century droughts are a poor reflection
of the nature of this hazard in previous centuries. Droughts of the late 13th and
16th Centuries in the USA for example were more prolonged and severe than
those of the 20th Century and Dean (1997) has recognised that droughts here,


Search WWH ::

Custom Search