Geoscience Reference
In-Depth Information
18
21
20
16
19
14
18
12
17
10
16
15
14
8
13
12
6
11
4
4
10
8
6
5
7
9
2
0.05 probability level
3
2
0
0
1000
2000
3000
4000
5000
Record length (years BP)
1 Random numbers 1
2 Random numbers 2
3 Random numbers 3
4 Bristlecone pine tree rings (US)
5 Nino 3
6 Chillagoe speleothem layers
12 Palmer drought severity index (USA)
13 US tree rings
14 Roratonga sea surface temperatures
15 New Mexico tree rings
16 Agincourt Reef coral layer density
17 Beijing speleothem layers
18 Pacific decadal oscillation
7 White River discharge
8 North Atlantic Oscillation
19 Abraham Reef coral layer density
20 Sanctuary Island coral layer density
21 Caribbean sea surface temperatures
9 Sacramento River discharge
10 Burdekin River discharge
11 Yellowstone River discharge
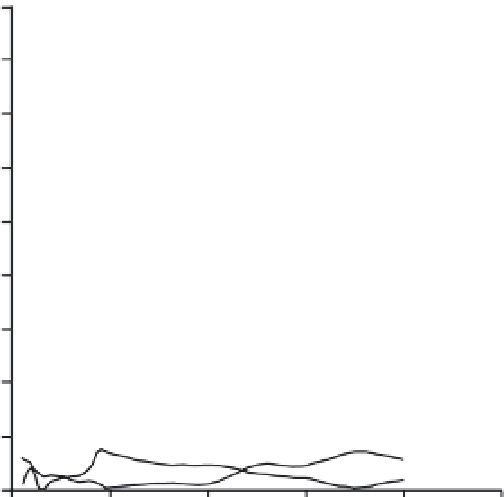
Figure 10.2.
Results from Runs test for randomness of various long-term,
high-resolution time series. (Data from 4, Hughes and Graumlich,
1996
;5,Cook,
2000
;6,J.Nott; 7, Cleaveland,
2000
;8,Cook,
et al
.,
2002
;9,Meko
et al
.,
2001
;10,
Isdale
et al
.,
1998
;11, Graumlich
et al
.,
2003
;12, Cook,
2000
;13, Cook
et al
.,
1996
;14,
Linsley
et al
.,
2000
;15, Grissino-Mayer,
1996
;16, 19, 20, Lough and Barnes,
1997
,
2000
; Chalker and Barnes
1990
;17,Tan
et al
.,
2003
;18, Biondi
et al
.,
2001
;21,Winter
et al
.,
2000
.)
then the first 200 years and first 300 years and so on. In the vast majority of cases
the
Z
scores exceeded the 0.05 probability level suggesting that these long-term
records are serially correlated (Fig. 10.2). The
Z
scores also increase with time
or length of record. Some of the shorter length records (Chillagoe speleothem
layers, Sacramento River discharge and White River discharge) did not reach the
critical Z score of 1.9 (or 0.05 probability); however, the steep upward trend
of the curve shows that if each of these records were 50--100 years longer
they would invariably display serial correlation. The
Z
scores of the random


Search WWH ::

Custom Search