Geoscience Reference
In-Depth Information
T
1
T
2
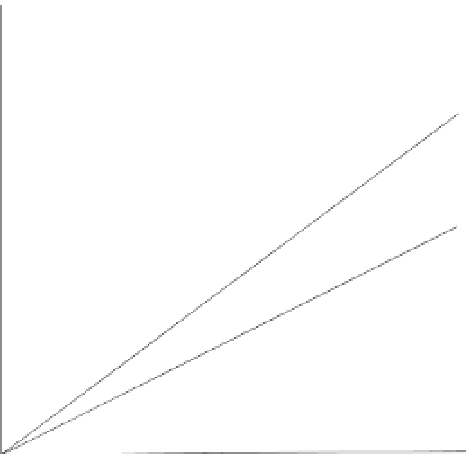
X
Decreasing frequency of event occurrence
Figure 1.4.
Non-homogeneity of magnitude--frequency relationship over time.
theline steepens, events of greater magnitude will occur more frequently. The
converse is true when the slope of the line decreases. These changing relation-
ships are showninFigure1.4.Twolines are presented here. Each line represents
adifferent relationship between the frequency of occurrence of an event and
its associated magnitude. An event with frequency
X
will have a magnitude of
T
1
during a period named here as Time 1, and magnitude
T
2
during the period
Time 2. These periods may be years, decades, centuries or millennia in length.
This is non-stationarity (see Fig. 1.5).
Stationarity, therefore, can only be assumed to occur for limited periods of
time. The length of these periods is variable, and they will often dominate an
entire short historical observational record. Hence, these records will not dis-
play non-stationarity even though this is the normal behaviour of a hazard over
thelonger term. Planners might say that the length of the period in question
(i.e. the current period of stationarity) is longer than the proposed planning
cycle so what is the use of attempting to test for non-stationarity. However, if
we choose not to recognise that these changes occur we will not seek explana-
tions for the cause of these changes and without knowing the causes we will
not endeavour to understand the changes. Hence, we will not know when a
change is likely to occur. If such changes do occur within the planning period,
and because stationarity is assumed, the occurrence of a high-magnitude event
will be regarded as an outlier, or an event of much lower frequency. This, of
course, has implications for insurance premiums and claims, and future policy
and planning. It also affects the way we perceive risk and, therefore, influences


Search WWH ::

Custom Search