Geoscience Reference
In-Depth Information
50%
150
125
40%
100
30%
75
20%
50
10%
25
0%
0
1820
1840
1860
1880
1900
1920
1940
1960
1980
Year
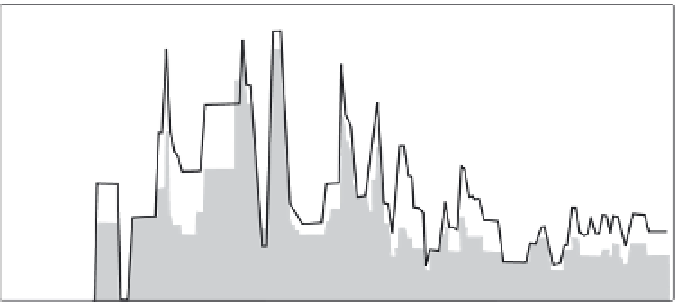
Figure 7.8.
Visual growth anomaly index related to landslide area. The first
registered disturbance occurred in AD 1845. The strongest events occurred between
AD 1860 and 1896 as these affected up to 45% of the trees. The period between
AD 1905 and 1950 shows a progressive decrease in trees affected from 40% to 23%,
suggesting less intense events. The period between 1951 and 1995 shows least
disturbance with affected trees not exceeding 16% (from Fantucci and Sorriso-Valvo,
1999
).
each year and the total number of samples from each year. The following equa-
tion from Fantucci and Sorriso-Valvo (1999)describes this relationship
n
(
Sup
(
x
)
t
×
(
Fx
))
t
=
1
anomaly index (It)
=
100%
(7.2)
n
(
N
tot
)
t
t
=
1
where,
Sup
(
x
)
t
=
intensity coefficient expressed by integers in a rank scale from 1 to 4 according
to increasing intensity of suppression. These values correspond to slight, mod-
erate, strong to very strong. (
N
tot
)
=
thenumber of suppressions of each class (
x
)inyear(
t
),
Fx
=
the total number of samples analysed in
year
t
.
The visual growth analysis method places more emphasis on events that have
resulted in strong suppression in trees (Fantucci and Sorriso-Valvo, 1999). Ages
based on this technique sometimes need to be treated with caution as varia-
tions in ring width can also result from other factors such as climate, complex
competition between trees as well as disease. The findings can only be deemed
reliable if the samples exhibit strong replication and if other disturbing forces
have been ruled out (Lang
et al
., 1999).
Fantucci and Sorriso-Valvo (1999)usedvisual growth analysis to make com-
parisons between landslide events and records of seismic and hydrological


Search WWH ::

Custom Search