Geoscience Reference
In-Depth Information
Outlier events
2
1
500
0
100
50
Return interval (yrs)
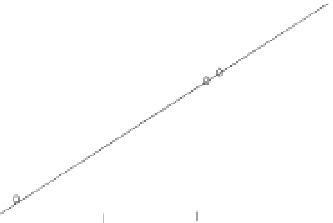
Figure 1.3.
Magnitude--frequency curve and outlier points.
can be seen to fall roughly on a straight line; however, two events do not. These
two events are referred to as 'outliers' and they are of higher magnitude than
any other events to have occurred over the past 100 years. The probability dis-
tribution suggests that despite the fact that these outlier events have occurred
within the last 110 years they do not belong to the normal range of events that
could be expected to occur within this time frame. By extending the line repre-
senting the magnitude--frequency relationship for this particular hazard, these
events appear more likely to correspond to the approximately 1 in 500 year event
(0.2% AEP). Such a conclusion is firmly based upon the assumption that the slope
of the line representing the magnitude--frequency relationship is applicable to
any 100 year period. Therefore, this line, which only covers events from the last
100years, is typical of any 100 year period. When we make this assumption
we also deem it safe to extrapolate this line to determine an accurate estimate
of the size of less frequent events. Whether this is a realistic interpretation of
thenature of the natural hazard, however, is rarely ever tested during the risk
assessment process. Nor is the possibility that non-stationarity may be evident
when longer time series or records of events are examined. In the above situa-
tion stationarity has been assumed. Unfortunately though, nature rarely displays
stationarity over the long term.
Stationarity in time series
Stationarity occurs when the relationship between the magnitude and
thefrequency of an event and/or its variance remains unchanged with time. Non-
stationarity refers to a condition where the relationship between the magnitude
and frequency and/or variance changes over time. In the former case this can
be reflected as a change in the slope of the magnitude--frequency line. In these
situations the magnitude of a certain frequency hazard changes. If the slope of


Search WWH ::

Custom Search