Geoscience Reference
In-Depth Information
Figure 6.
Expenditure under different carbon prices. Incentives... periodic payments for standing
biomass, All... payments are done, without considering the effectiveness of the payment, in all regions,
Region... payments are done in regions where the payments protect forest against deforestation,
Affected... payments are done for forests where the payments protect them against deforestation.
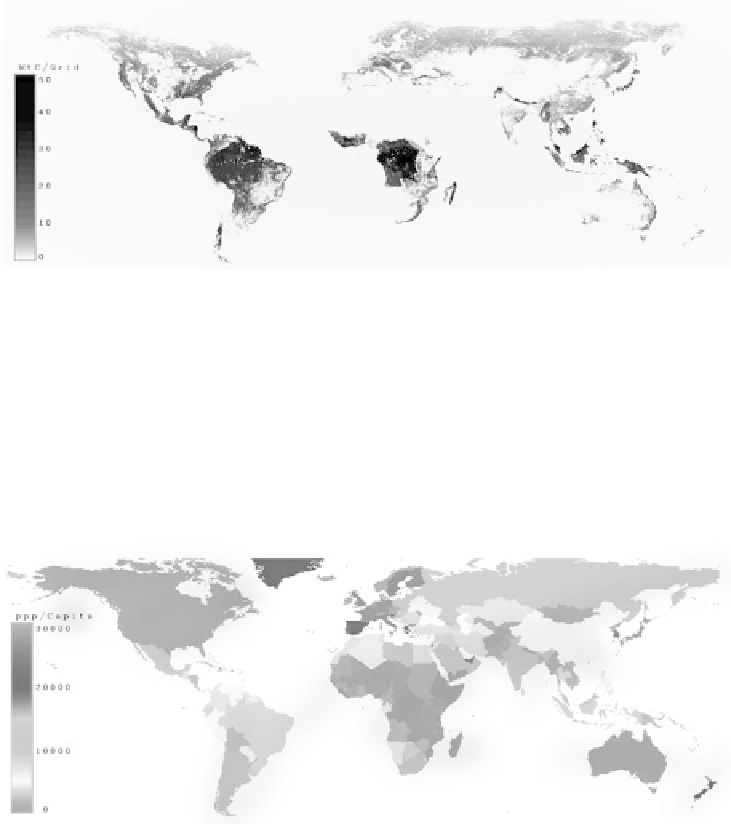
Figure 7 shows the PPP which was used to calculate a price-index. It can be seen
that the poorest countries are in Africa and the richest in North America, Europe,
Australia, and Japan.
Figure 7.
Cash flow until 2100 for different carbon prices. Incentives... periodic payments for
standing biomass, Tax... payments for harvesting wood, Affected... payments are done for forests
where the payments protect them against deforestation, Burn... felled wood is burned immediately,
Sell... harvested wood is sold, Burn/Sell... share of the wood will be burned the other part sold.
Figure 8 shows the discount-rates given in (Benítez et al., 2004). Here also the
richest countries have the lowest discount rates.